Fig. 5.

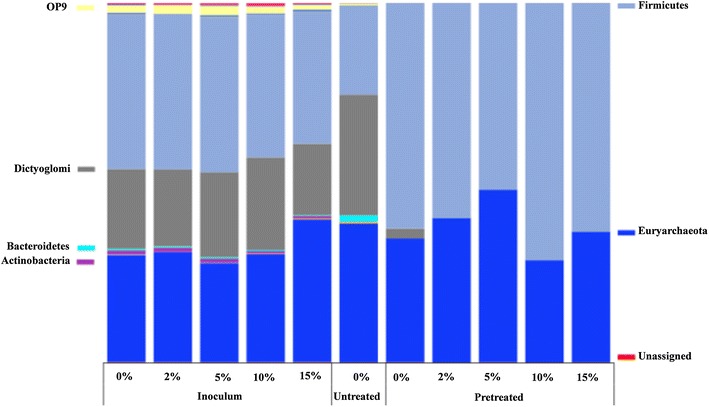
Relative abundance of bacterial and archaeal OTUs at phylum level. Taxonomic groups with relative abundance lower than 1% were excluded from the plot legend flanking the bars

Relative abundance of bacterial and archaeal OTUs at phylum level. Taxonomic groups with relative abundance lower than 1% were excluded from the plot legend flanking the bars