
Fig. 1.
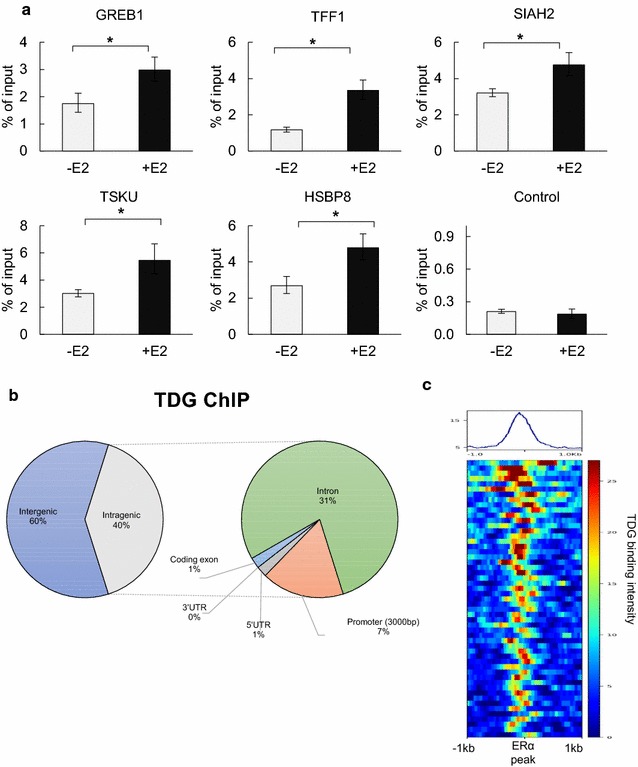
Global analysis of E2-dependent TDG localization. a MCF7 cells were treated with 100 nM of E2 (45 min) and ChIP-qPCR was performed using TDG antibody. Region used as negative control shows low level of TDG binding in ChIP-Seq data with no change in levels after E2 treatment. (*p value < 0.05, error bars represent standard deviation of the mean, n > 2). b Sites of E2-dependent TDG binding were mapped to the annotated genome using CEAS. c Sites of ER binding (∓ 1000 bp) overlaid with TDG binding signal, showing strong relationship between location of TDG binding and ER binding at these regions