Figure 4.

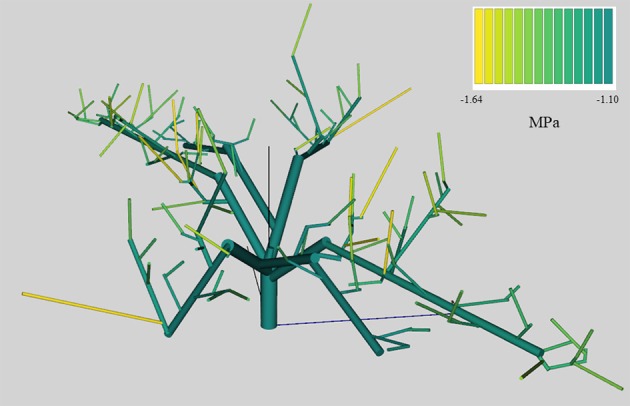
Stem water potential at 14 h in mid-July (14th) of an Elberta peach tree, under the low stress (LS) treatment, simulated by QualiTree. The colors represent the stem water potential values (MPa) for each FU.

Stem water potential at 14 h in mid-July (14th) of an Elberta peach tree, under the low stress (LS) treatment, simulated by QualiTree. The colors represent the stem water potential values (MPa) for each FU.