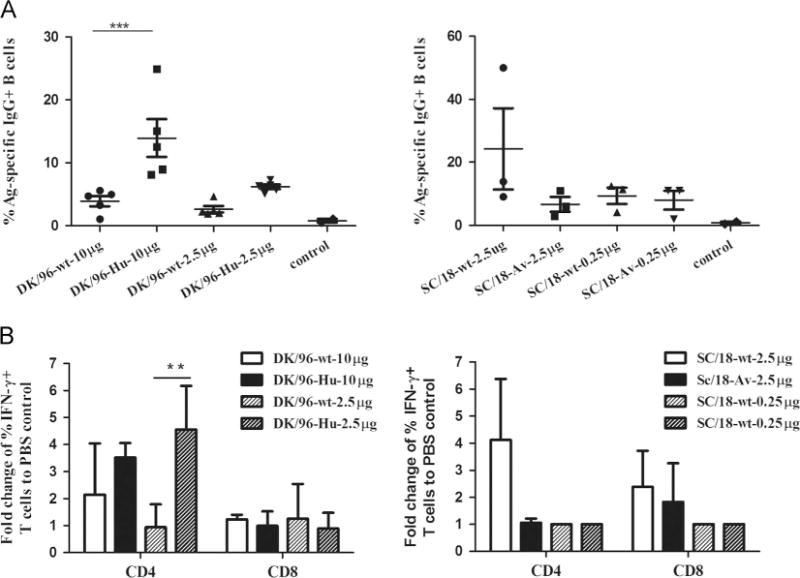
Fig. 5.

The cell-mediated immune response upon vaccination with 1918 virus. (A) Groups of 3–5 mice are vaccinated i.m. with DK/96-wt and DK/96-Hu (10 or 2.5 μg) or SC/18-wt and SC/18-Av (2.5 or 0.25 μg) vaccines. Fourteen days later, spleen tissues are harvested and the frequency of virus-specific IgG+ASCs are measured by ELISPOT assay. The number of virus-specific IgG+ASCs is normalized against the number of total IgG+secreting ASCs and presented as % Ag-specific IgG+B cells. (B) Mice are vaccinated with DK/96-wt and DK/96-Hu (10 or 2.5 μg) or SC/18-wt and SC/18-Av (2.5 or 0.25 μg). Fourteen days post-immunization, spleen are harvested and the frequency of IFN-γ-producing CD4+ and IFN-γ-producing CD8+ T cells from immunized mice is measured by intracellular cytokine staining following 5 days in vitro culture after infection for 1 h with DK/96 or SC/18 virus. Statistical significance is determined by two-way ANOVA. ** indicates statistical significance (p<0.01) between Dk/96-Hu and Dk/96-wt vaccine, *** p<0.001.
