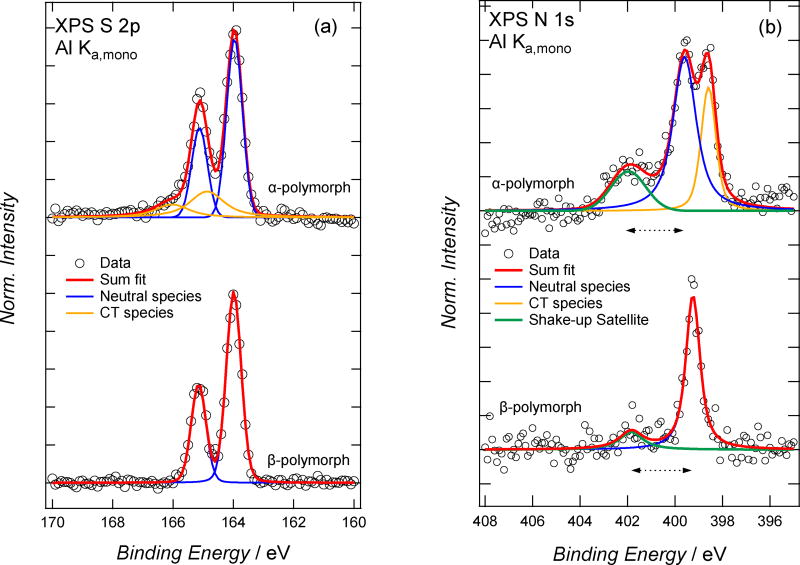
Figure 3.
XPS for α-DBTTF-TCNQ (top) and β-DBTTF-TCNQ (bottom). The S-2p spectra are shown in (a), and N-1s spectra in (b). Data (open circles) and spectral fits (as solid lines) of neutral and CT moieties as well as the shake-up satellite are shown. The horizontal arrow line in (b) indicate the estimation of the HOMO-LUMO transition, in the presence of a core-hole, of the TCNQ moiety in each polymorph.

