Fig 8.
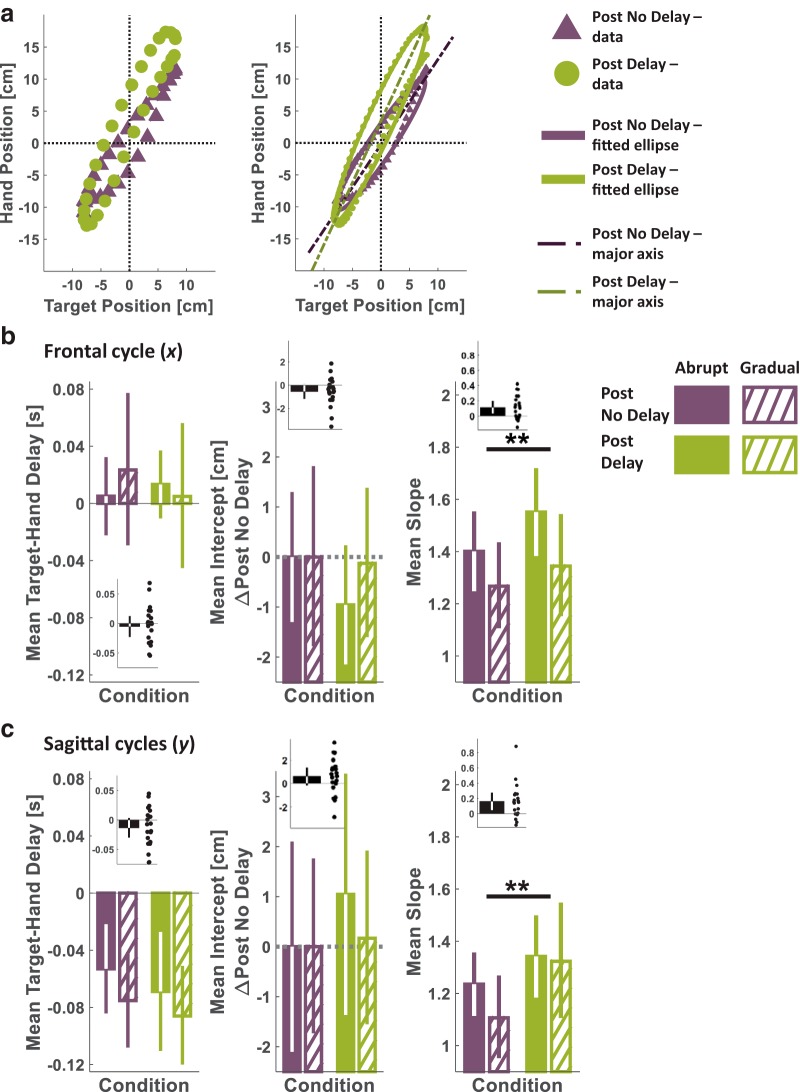
Experiment 3: tracking experimental results suggest a State Representation of delay as either a Gain or a Mechanical System equivalent rather than a Spatial Shift. a, Single participant’s results. Target-hand position space of a single sagittal cycle from each of the Post No Delay (purple triangle) and Post Delay (green circles) Blind Track sessions. The left panel presents data points sampled at 11.8 Hz. The right panel presents data points sampled at 28.6 Hz and fitted ellipses for the entire data distribution (sampled at 200 Hz) from each of the Post No Delay (purple) and Post Delay (green) tracking sessions, together with the corresponding major axis lines (dashed-dotted dark purple and dashed-dotted dark green, respectively). b, c, Group analyses for the frontal cycle (b) and the sagittal cycles (c) of the delay between the hand and the target (left), and the major axis intercepts (after subtraction of each group’s average Post No Delay intercept, middle) and slopes (right), extracted from participants’ tracking performances. Colored bars represent each participant’s mean, from each of the Post No Delay (purple) and Post Delay (green) tracking sessions, averaged over all the participants in each group (Abrupt: filled, n = 10, Gradual: diagonal lines, n = 10). The black bars (insets) represent the mean difference for each measure between the Post Delay and the Post No Delay blind tracking sessions. Dots represent differences of individual participants. **p < 0.01.

