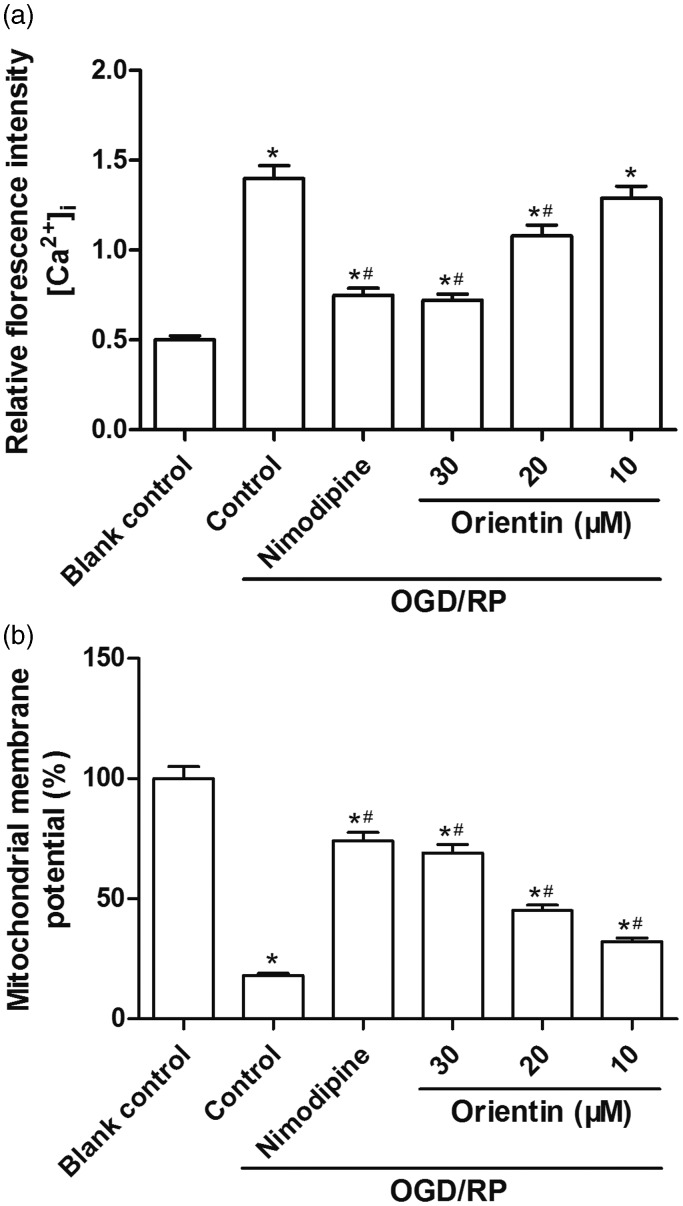
Figure 3.
Effects of different concentrations of orientin on [Ca2+]i and MMP alterations in primary rat cortical neurons under OGD exposure for 6 h followed by reoxygenation for 24 h. (a) The [Ca2+]i was detected using flow cytometry analysis. The relative fluorescent intensity of Fluo-3 was used to indicate the [Ca2+]i quantity. (b) The MMP was monitored using a fluorescence method. *P < 0.05 versus Blank control, #P < 0.05 versus Control.MMP: mitochondrial membrane potential; OGD: oxygen-glucose deprivation.

