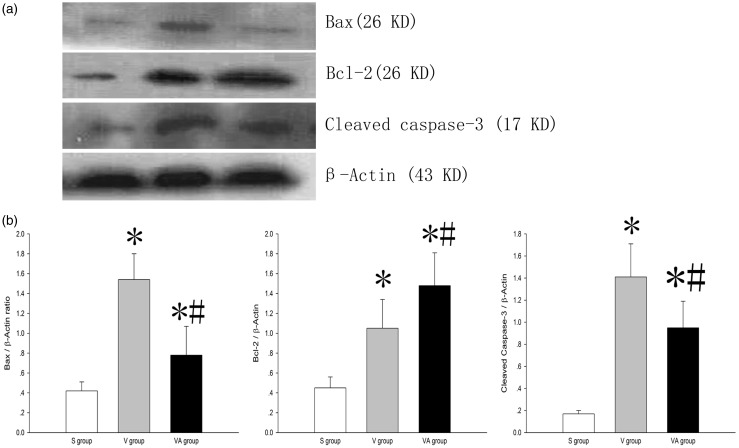
Figure 7.
The effect of AAT on the protein levels of Bax, Bcl-2, and cleaved caspase-3 in the lung tissues in VILI. (a) Western blot analysis of protein expression as indicated and (b) quantification of Western blot analysis in A. *P < 0.05, versus S group; #P < 0.05, versus V group (n = 8). S: sham; V: ventilation + saline; VA: ventilation + AAT.

