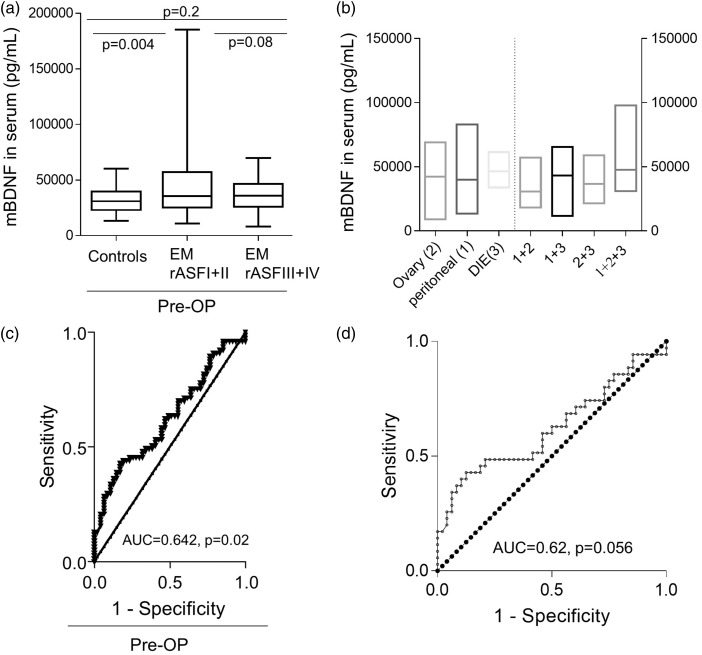
Figure 2.
Serum mBDNF levels are disease-stage specific but they are not predictive for the disease. (a) Graphical representation of the influence of rAFS stages on total serum mBDNF levels is given. For each group, the comparison was performed using one-way ANOVA and Bartlett’s test to account for multiple group comparisons. The resulting P-values are indicated within the graphs. (b) Graphical representation of the influence of ectopic lesion location on total serum mBDNF is plotted. The mean values of the levels of the serum protein are indicated on each boxplot. Statistical multiple group analysis of the data (Kruskal–Wallis and Dunn multiple comparisons tests) showed that the differences in the levels of secreted protein between the groups are random (adjusted P-value, P > 0.05) and not associated with the type of the lesions. (c) Diagnostic predictive value of mBDNF for endometriosis expressed by ROC-curve analysis of the protein level in serum obtained in a cohort of 128 cases and controls. The AUC and P-values are indicated in each graph. (d) Prediction strength of mBDNF to discriminate between stages I and II endometriosis and endometriosis free controls – expressed by ROC-curve analysis of the protein level in serum obtained in a cohort of 35 women suffering from endometriosis stages I and II and 51 women making up the endometriosis free control group.

