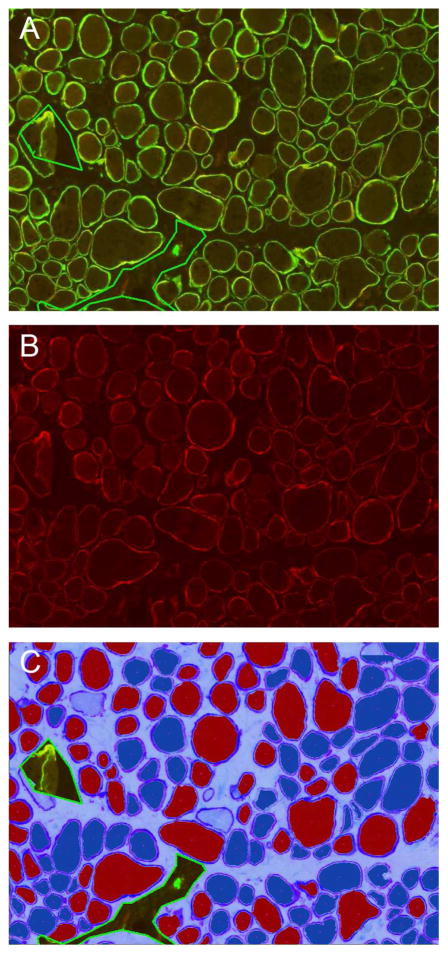
Figure 4. MuscleMap consistently scores protein expression in muscle fibers.
This panel shows the dual labeled assay in A (TRITC-dystrophin, FITC-spectrin), with just the TRITC-dystrophin image in B and the image analysis markup in C showing positive and negative fibers. A fiber is classified as negative (dark blue cytoplasm in C) or positive (red cytoplasm in C) based on achieving a minimum with respect to membrane intensity and % circumference at that threshold. The image in C shows three areas of artifact excluded from analysis (indicated by the green line) as well as several fibers not meeting the fiber definition (light blue center) and not included in the analysis.

