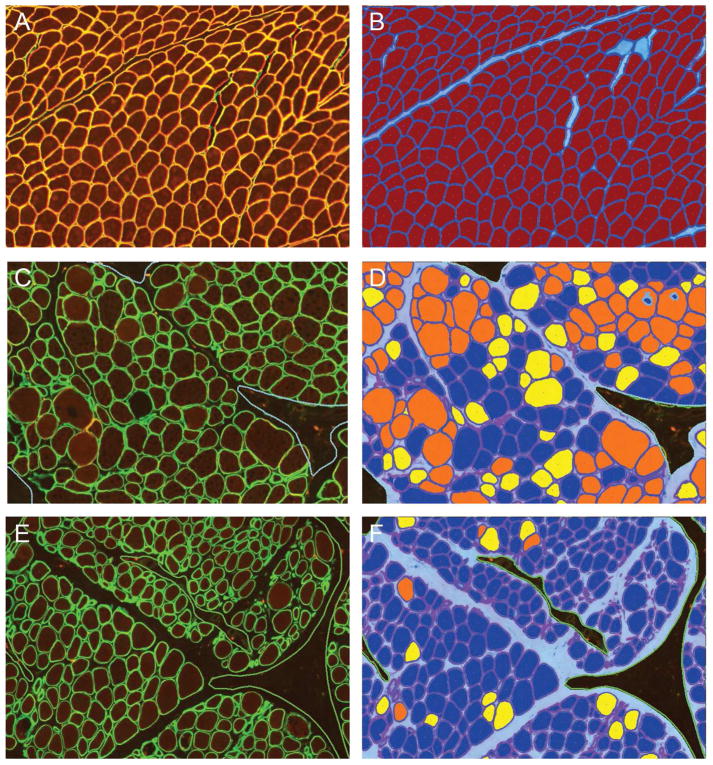
Figure 5. MuscleMap separates muscle fibers by expression intensity.
This panel shows the dual labeled images in A, C, and E and the respective image analysis markups in B, D and F. In B, D and F, muscle fibers have been classified by intensity, where dark blue = negative, yellow = low intensity, orange = medium intensity and red = high intensity. Similar to Figure 4, areas of artifact (dashed green line) and myofibers not meeting the fiber definition (light blue center) were not included in the analysis. Muscle in A, C and E are from a non-DMD/non-BMD control, BMD patient and DMD patient, respectively.

