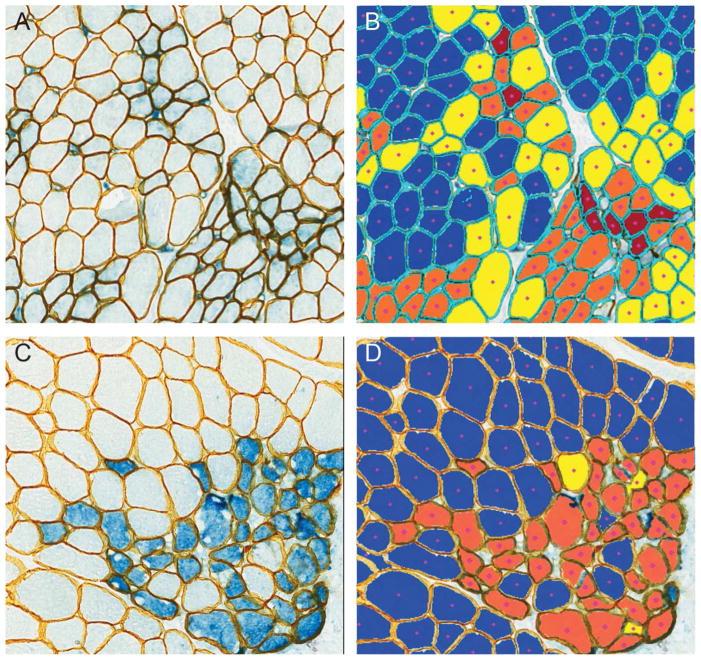
Figure 6. MuscleMap measures pathologist-impossible endpoints.
This panel shows DMD muscle samples stained with two duplex IHC assays: in A, utrophin is in blue and laminin-α2 is in yellow, and in C, developmental myosin heavy chain is in blue and laminin-α2 is in yellow. In images B and D, muscle fibers have been classified by intensity, where dark blue = negative, yellow = low intensity, orange = medium intensity and red = high intensity. Myofibers not meeting the fiber definition (uncolored) were not included in the analysis.

