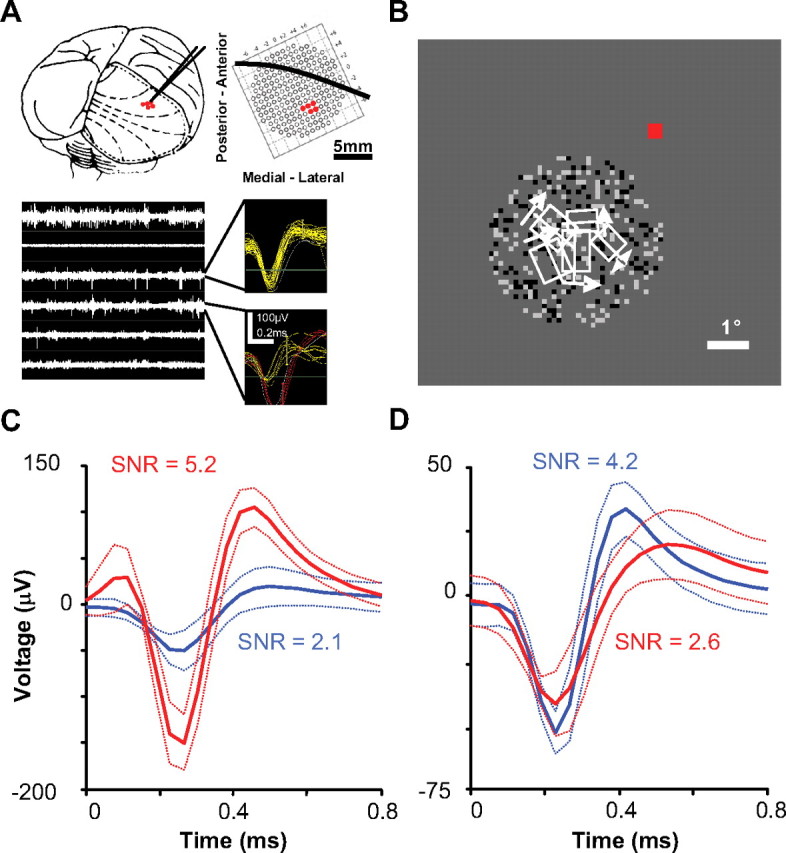
Figure 1.

A, B, An example recording session. In this session, we used three dual electrode microdrives in a 2 × 3 configuration (one electrode failed to record neural activity and was disconnected). A, Position of the six-electrode array with respect to the macaque brain and the grid where microdrives were attached within the recording chamber (dashed lines are approximate retinotopic coordinates and solid black line overlaying the grid is approximate location of the lunate sulcus based on several previous recording sessions within this chamber). The bottom plots show filtered neural activity for all channels and samples of triggered and on-line sorted action potentials. B, Receptive field locations (minimum response field) with respect to fixation (red) and DRDS stimulation. C, D, Examples of multiple waveforms (dotted lines are SDs) recorded on the same electrode. C, We typically encountered multiple units that were easily distinguishable (these are waveforms for the competitive example pair of neurons described in the main text). D, The most waveform overlap that was allowed to consider multiple waveforms on the same electrode for cross-correlation analysis.
