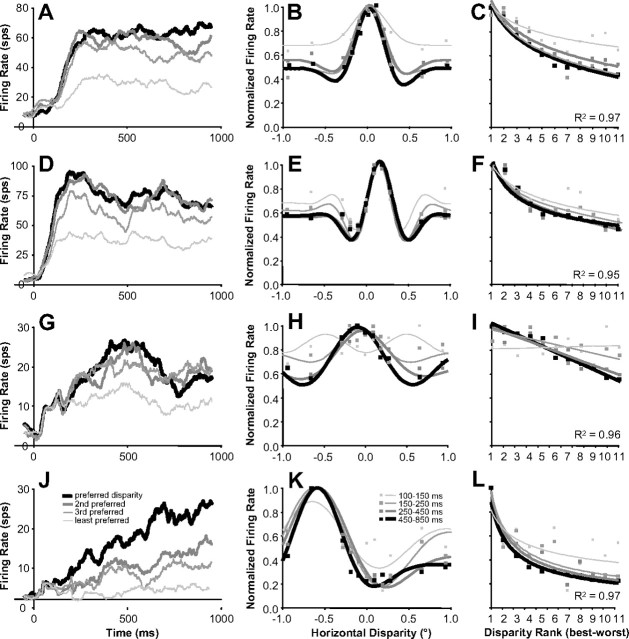
Figure 10.
Disparity tuning improved over time (examples). A, D, G, J, Examples of firing rates over time for preferred and progressively less preferred disparities. B, E, H, K, Disparity-tuning curves of same example neurons computed at progressively later intervals from stimulus onset (Gabor fits). C, F, I, L, Tuning curves of same example neurons ranked from the disparity presented that caused the strongest (best) to the weakest (worst) response (linear, log, and power fits). Note that the vertical axis is the same between the center and right column (peak-normalized firing rate). All average firing rates are based on n = 60 trials.

