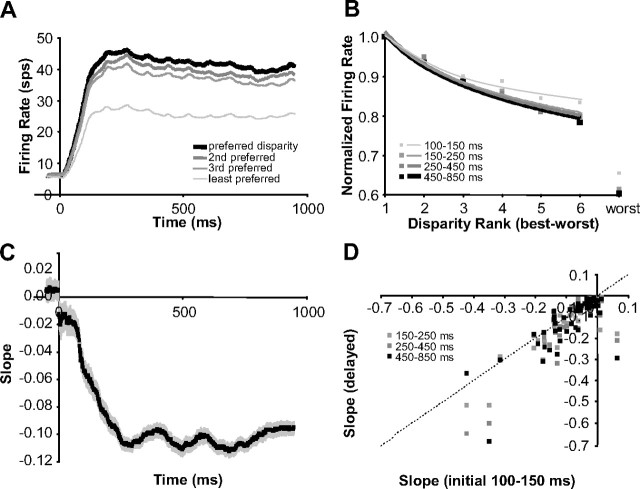
Figure 11.
Disparity tuning improved over time (population statistics). A, Population average of firing rate over time for preferred and progressively less preferred disparities. B, Population average of disparity tuning computed at progressively later intervals from stimulus onset (normalized by the peak response in each interval). C, Population average of the slopes computed by linear, log, and power fits of ranked disparity responses over time (rank determined over entire stimulation period). D, Scatter plot of slopes computed at progressively later intervals versus slopes computed during the initial interval. Error bars are population SE (n = 60 neurons).

