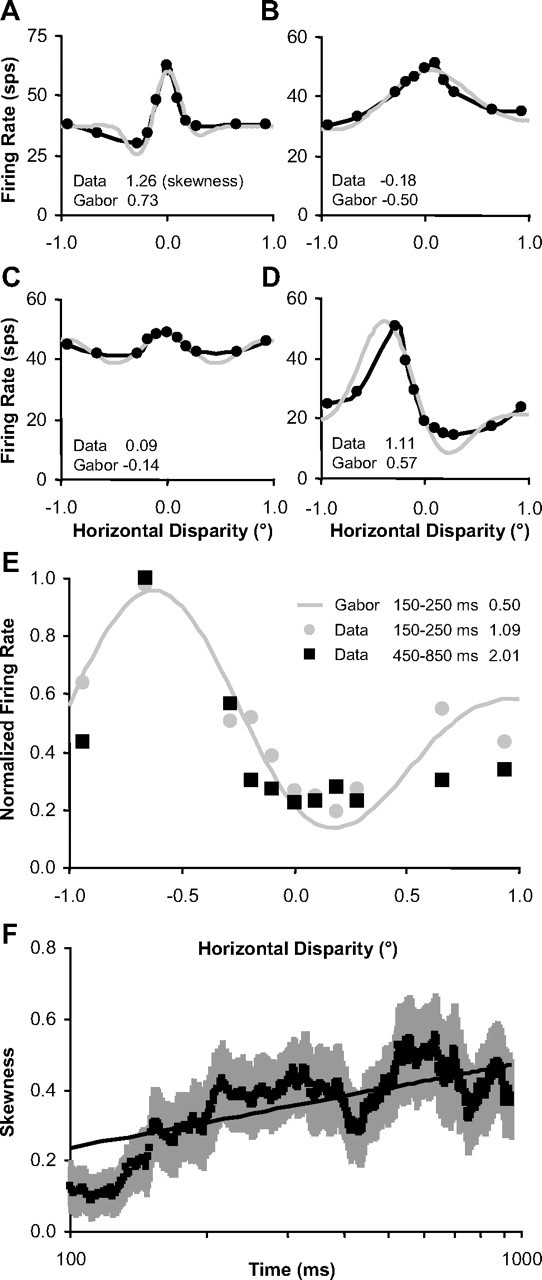
Figure 13.

Disparity-tuning skewness increased over time. A–D, Examples of disparity-tuning curves (black) that deviate from fitted Gabor functions (gray). Skewness values for data and Gabor fits are listed in the bottom left corner of each plot. E, Example taken from Figure 10K to demonstrate increasing skewness with respect to time (skewness listed on the right side of the legend). F, Population average of skewness versus time for n = 24 neurons with the most robust disparity tuning (see text). Error bars are population SE, and straight line is logarithmic regression fit.
