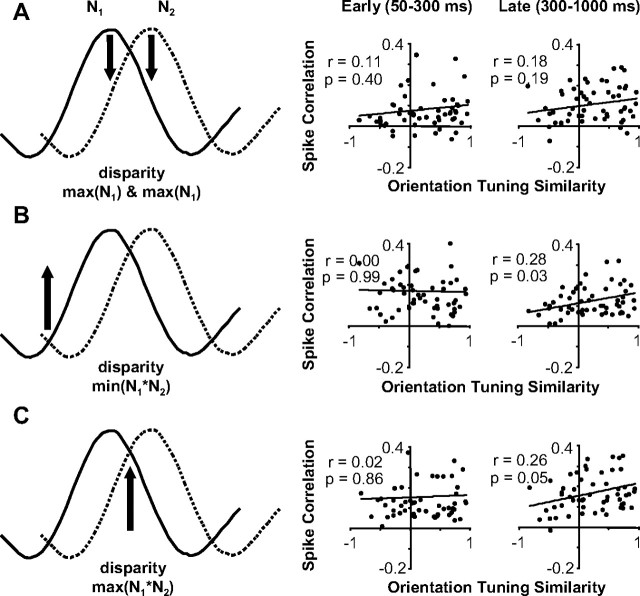
Figure 14.
The relationship between spike correlation and orientation-tuning similarity considering disparity presented and response latency (during DRDS presentation). A, Data for all neuronal pairs when a preferred disparity was presented (maximum of N1 and N2). Scatter plots of spike correlation versus orientation-tuning similarity for early (50–300 ms; left) and late (300–1000 ms; right) period of stimulation. B, Same organization as A, but for data when the common least preferred disparity was presented (minimum of N1*N2). C, Same organization as A, but for data when the common most preferred disparity was presented (maximum of N1*N2). All regression analysis was based on n = 63 pairs.

