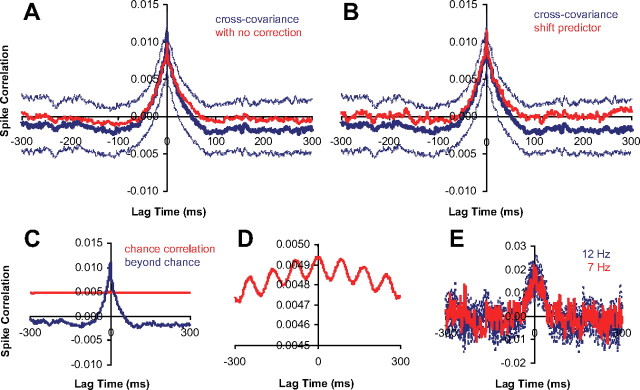
Figure 2.
A, B, Population average of normalized CCHs (n = 63 pairs, centered on their peak). The dotted lines are population average of individual pairs' 95% confidence intervals (n = 60 trials). A, Raw cross-covariance derived CCH (red) versus excitability corrected and bootstrapped CCH (blue). B, Shift-predictor CCH (red) versus excitability corrected and bootstrapped CCH (blue). C, Population average CCH (blue) and chance correlation (red). D, Zoomed-in plot of chance correlation. E, Example CCH for DRDS modulated at 12 or 7 Hz (dashed lines are bootstrapped 95% confidence interval; n = 60 trials).

