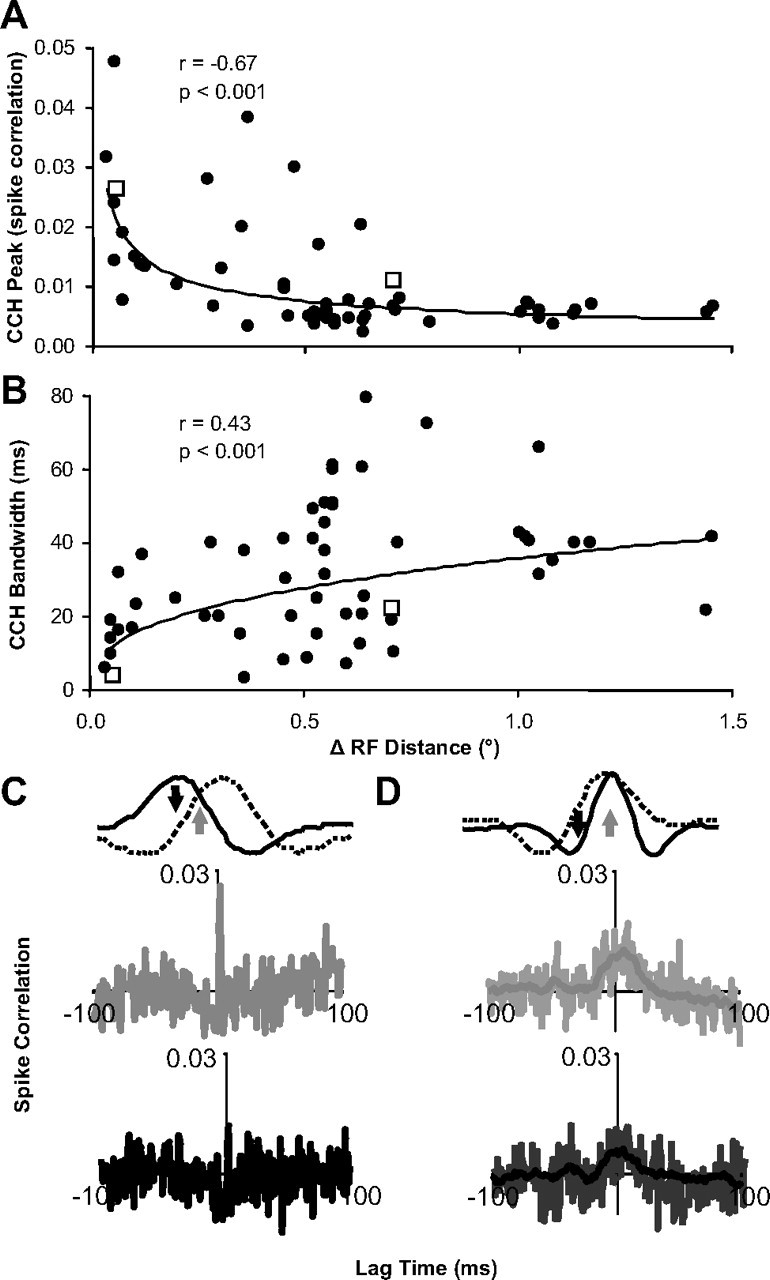
Figure 5.

Distance and stimulus dependence of spike correlation properties. A, Scatter plot of the CCH peak height versus distance between receptive field centers for each pair of neurons (n = 63 pairs; power fit). B, Scatter plot of the CCH peak width (half-height) versus distance between receptive field centers for each pair of neurons (n = 63 pairs; power fit). C, D, Example CCHs (A, B, open squares) for overlapping and neighboring receptive fields, respectively, when a disparity was presented that led to a strong response for both neurons (gray) and a stronger response in one neuron relative to the other neuron (black) (n = 60 trials). In D, the light lines in each CCH plot are raw estimates, and the darker lines are smoothed data that were used for any analysis described in the article.
