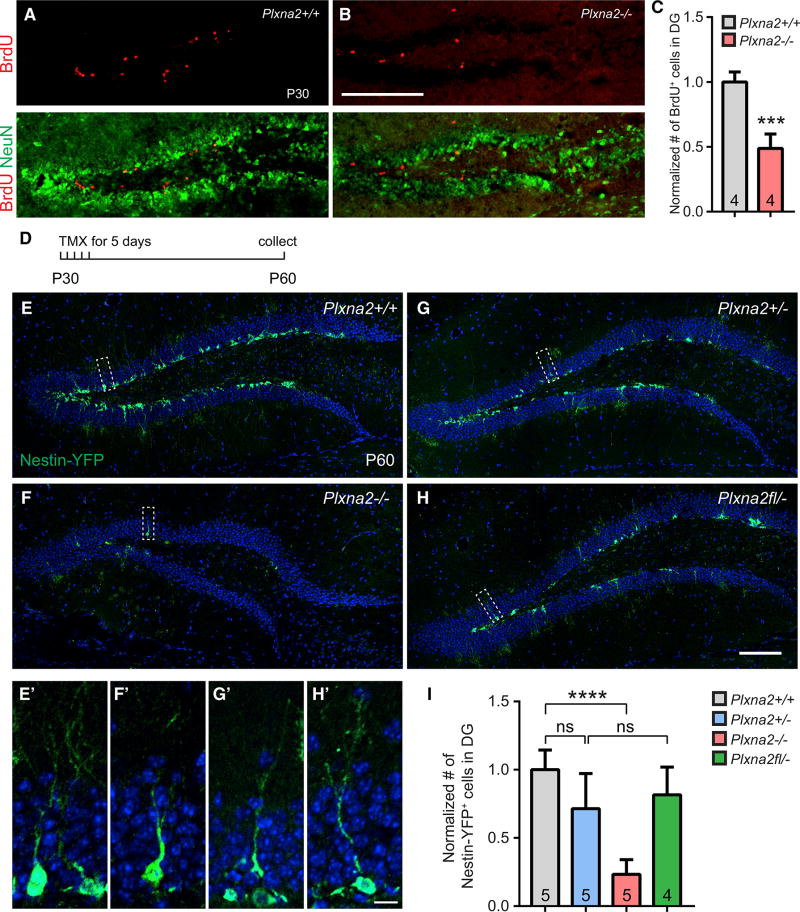
Figure 2. Plxna2 Regulates Cell Proliferation and Formation of the Stem Cell Niche in the SGZ.
(A and B) Coronal brain sections through the dorsal DG of P30 (A) Plxna2+/+ (n = 4) and (B) Plxna2−/− (n = 4) mice, stained with anti-BrdU and anti-NeuN.
(C) Quantification of BrdU+ cells. Results are shown as mean value ± SD. ***p < 0.001, by unpaired two-tailed Student’s t test.
(D–I) Fate mapping of nestin+ cells in the DG of Nestin-Cre-ERT2/R26R:YFP mice.
(D) Timeline of tamoxifen (TMX) administration and tissue collection.
(E–H) Coronal brain sections through the dorsal DG of P60 (E) Plxna2+/+ (n = 5), (F) Plxna2−/− (n = 5), (G) Plxna2+/− (n = 5), and (H) Plxna2fl/− conditional knockout (n = 4) mice on a Nestin-Cre-ERT2/R26R:YFP background. Progeny of nestin+ cells were visualized by anti-GFP immunofluorescence, and sections were counterstained with the Hoechst dye 33342.
(E’–H’) Higher magnifications of boxed areas shown in (E)–(H).
(I) Quantification of GFP+ cells normalized to cell counts (100%) in Plxna2+/+ mice. Results are shown as mean value ± SD. ****p < 0.0001, one-way ANOVA, with Bonferroni post hoc t test. ns, not significant.
Scale bars, 200 µm in (B), 100 µm in (H), and 10 µm in (H’).

