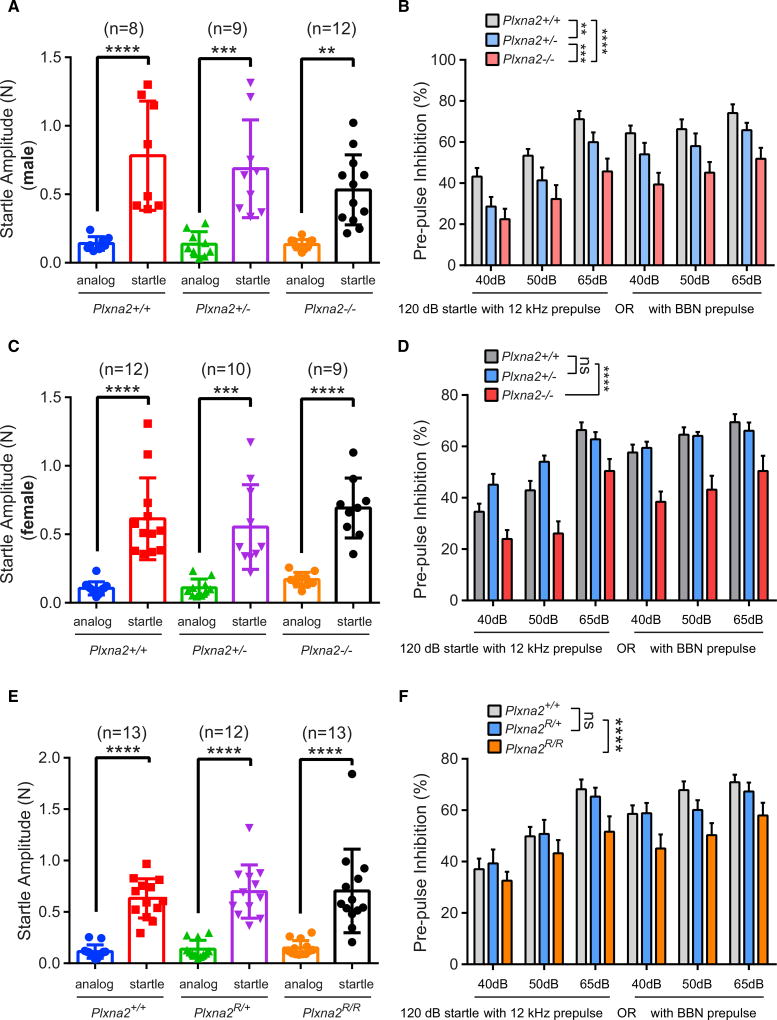
Figure 7. Defective Sensorimotor Gating in Plxna2−/− and Plxna2R/R Mice.
(A) Testing of the startle amplitude of male Plxna2+/+ (n = 8), Plxna2+/− (n = 9), and Plxna2−/− (n = 12) mice to a 120-dB sound.
(B) Percentile of PPI of the same cohort of mice with a prepulse delivered at 12 kHz or as broadband noise (BBN) at 40, 50, and 65 dB prior to the 120-dB startle sound.
(C) Testing of the startle amplitude of female Plxna2+/+ (n = 12), Plxna2+/− (n = 10), and Plxna2−/− (n = 9) mice to a 120-dB sound.
(D) Percentile of PPI of the same cohort of mice with a prepulse delivered at 12 kHz or as BBN at 40, 50, and 65 dB prior to the 120-dB startle sound.
(E) Testing of the startle amplitude of Plxna2+/+ (n = 13), Plxna2R/+ (n = 12), and Plxna2R/R (n = 13) mice to a 120-dB sound.
(F) Percentile of PPI of the same cohort of mice with a prepulse delivered at 12 kHz or as BBN at 40, 50, and 65 dB prior to the 120-dB startle sound.
Data are presented as mean ± SD in (A), (C), and (E); **p < 0.01, ***p < 0.001, and ****p < 0.0001, by one-way ANOVA, with Tukey post hoc t test. Error bars indicate SEM in (B), (D), and (F); **p < 0.01, ***p < 0.001, and ****p < 0.0001, by two-way ANOVA, with Fisher’s least significant difference (LSD). ns, not significant.

