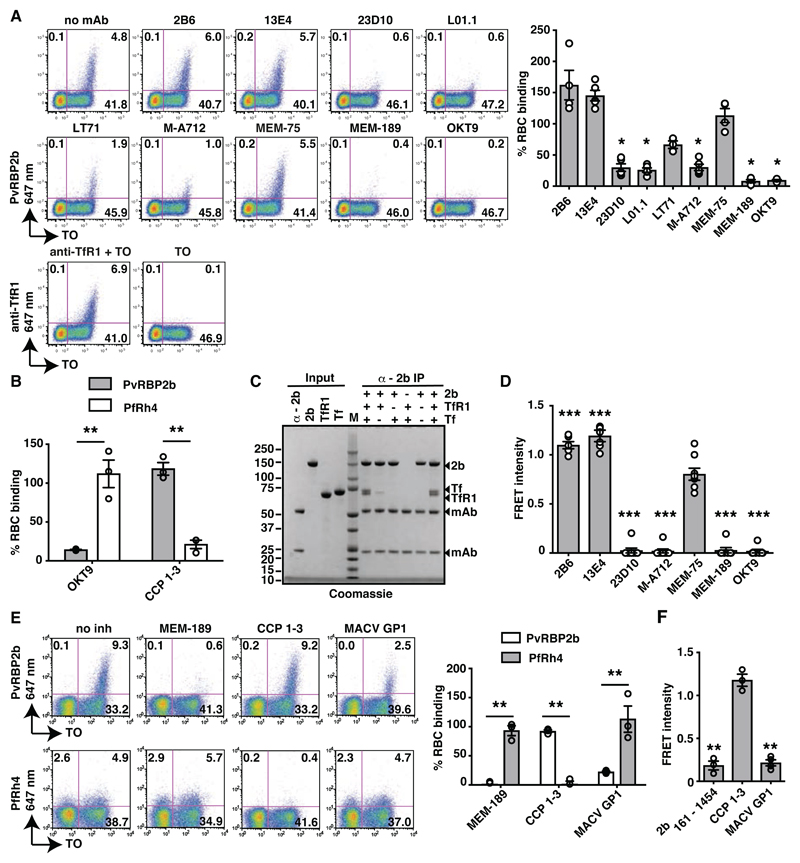
Fig. 1. PvRBP2b binds TfR1 on the reticulocyte surface.
(A). PvRBP2b161-1454 binding in the presence of anti-TfR1 mAbs analysed by flow cytometry. Left: Dot plots of PvRBP2b161-1454 binding (y-axis) to reticulocytes stained with thiazole orange (TO, x-axis). Right: normalized binding results where PvRBP2b161-1454 binding in the absence of mAbs was arbitrarily assigned to be 100%. (B) PvRBP2b161-1454 and PfRh428-766 binding were evaluated by flow cytometry with the addition of anti-TfR1 mAb OKT9 or CCP 1-3. PvRBP2b161-1454 and PfRh4 binding in buffer were arbitrarily assigned to be 100%. (C) Eluates of individual or mixtures of proteins immuno-precipitated with anti-PvRBP2b mAb analyzed by SDS-PAGE. + or – indicates protein present or absent. Molecular weight marker (M). (D) Anti-TfR1 mAbs inhibit PvRBP2b-TfR1 complex formation in the FRET-based assay. The FRET signal was relative to “no mAb” control. (E) Binding of PvRBP2b161-1454 and PfRh428-766 in the presence of anti-TfR1 mAb MEM-189, CCP 1-3 and MACV GP1. Left: dot plots showing PvRBP2b161-1454 (top) and PfRh428-766 binding (bottom). Right: normalized binding results where PvRBP2b161-1454 and PfRh428-766 binding in the presence of buffer was arbitrarily assigned to be 100%. (F) MACV GP1 inhibits PvRBP2b161-1454-TfR1 complex formation monitored by FRET assay. For (A), (B), (D), (E) and (F), Mean ± S.E.M., n ≥3, open dots represent biological replicates. Mann-Whitley test was used for (A) and (D) where MEM-75 was considered non-inhibitory and t-tests was used for (B), (E) and (F), * P ≤ 0.05, ** P ≤ 0.001.

