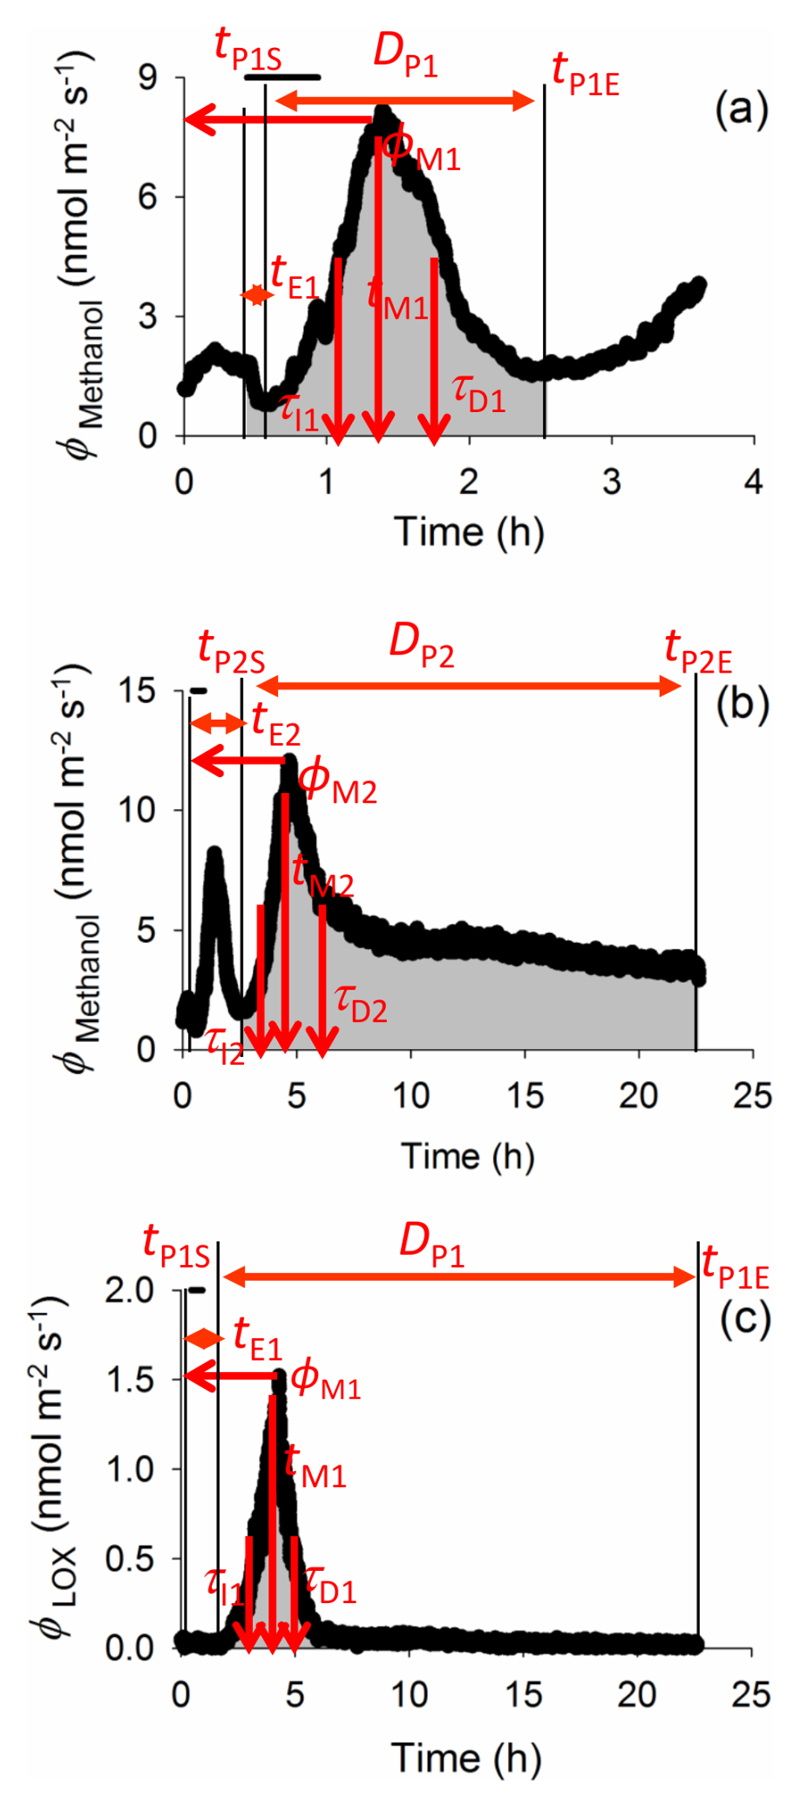
Figure 1.
A typical time-course of biogenic volatile organic compound (VOC) emissions from ozone-exposed Phaseolus vulgaris leaves, and definition of key quantitative emission characteristics: (a) first emission burst of methanol, (b) second emission burst of methanol and (c) emission burst of lipoxygenase pathway (LOX) volatile products (mainly various C6 aldehydes and alcohols). The emission pattern of methyl salicylate (MeSA) resembles LOX emissions in (c). In all cases, tE1 and tE2 are the times from the onset of O3 exposure to the elicitation of the first and (if present) the second burst of the given VOC species, respectively. ϕM1 and ϕM2 correspond to the emission maxima for the two bursts and tM1 and tM2 denote the corresponding times from the start of the elicitation to reaching the maxima. τI and τD indicate the initial doubling- and decay-times for the bursts. Integrated emissions for different emission bursts correspond to the shaded area for the duration of induced-emission bursts, DP, i.e. from the start of the given VOC emission elicitation (tPS) until the end of the given compound emission release (tPE; Eq. 3). As the experiment continued for 22 h after the O3 exposure, methanol emissions might not have always reached the initial level (b), and thus, DP and integrated emissions are somewhat underestimated in these cases. The vertical bars indicate periods for exposure to 600 nmol mol-1 O3.

