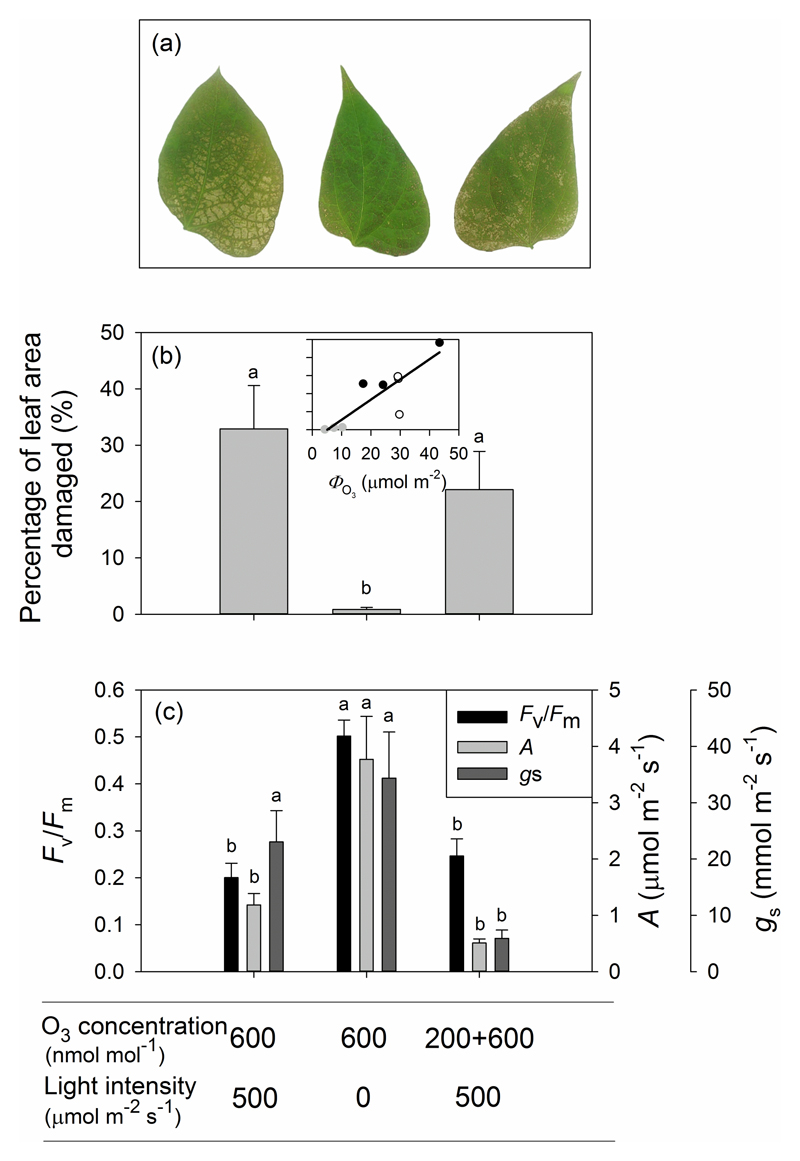
Figure 2.
Illustration of visible leaf injury in representative O3-fumigated leaves (a), percentage of leaf area damaged (b) and physiological data collected from P. vulgaris leaves before O3 fumigation and 21 hours after O3 fumigation (c). The relationship between the percentage of leaf area damaged and total amount of O3 uptake (ΦO3) in (b) were fitted by a linear regression (y=1.12x-5.69; r2=0.74, P<0.005). Error bars denote ± standard error (SE). The means were compared by ANOVA and the means separated by Tukey’s tests. Significant differences (P < 0.05) between means are indicated by different letters.

