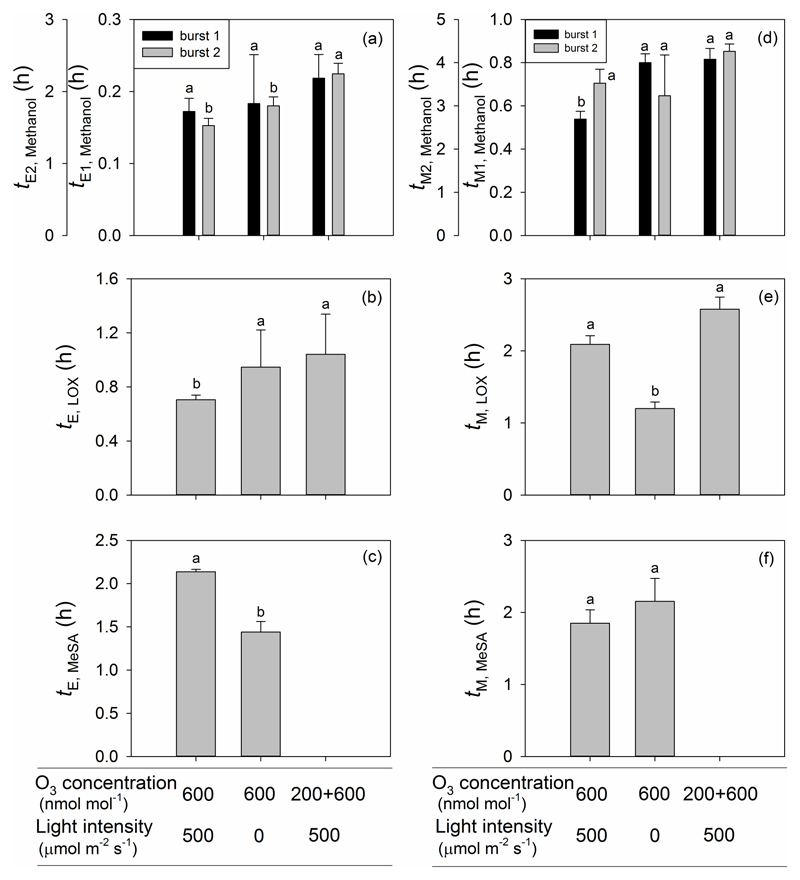
Figure 7.
The lag time from the onset of O3 exposure to the elicitation (a-c), and from elicitation to the maximum emission (d-f) for the first and second burst of methanol (a, d), LOX products (b, e) and MeSA (c, f) for three O3 treatments in P. vulgaris leaves. Error bars indicate ± SE. Treatments as in Fig. 5 and statistical analysis as in Fig.2.

