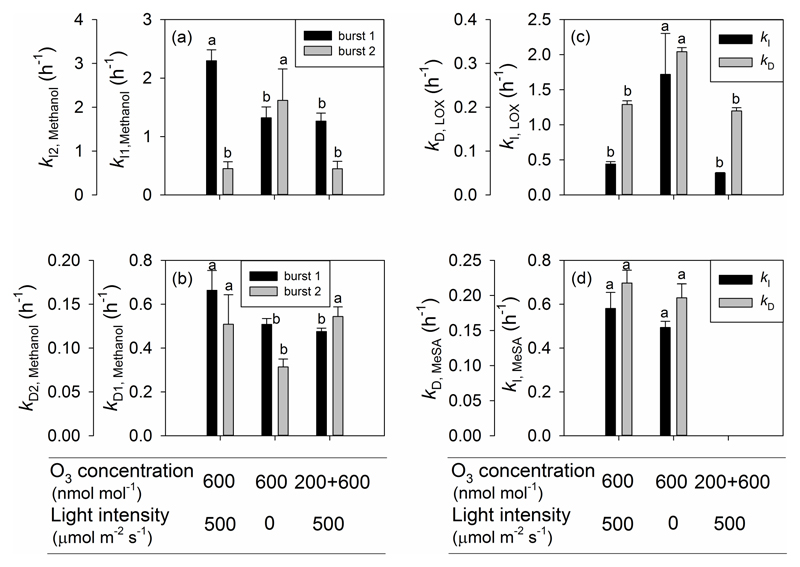
Figure 8.
The rate constant for the initial increase for the first and the second emission burst of methanol (a), LOX products (c) and MeSA (d), and the rate constant for decrease for the first and the second emission burst of methanol (b), LOX products (c) and MeSA (d) for three treatments in O3-exposed P. vulgaris leaves. Error bars indicate ± SE. Treatments as in Fig. 5 and statistical analysis as in Fig. 2.

