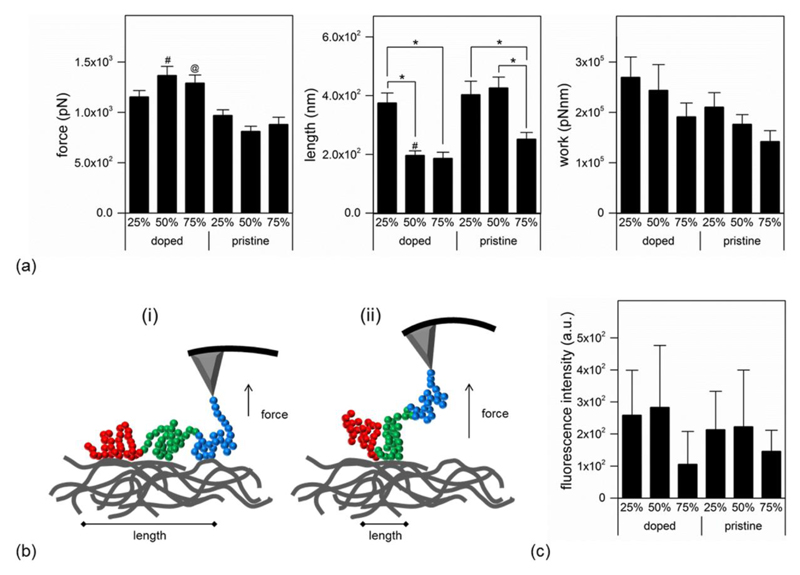
Fig. 3.
(a) Fibronectin – membrane interactions recorded with atomic force microscopy (AFM). Force recorded to remove Fn from the substrate, calculated length of the folded/unfolded protein, and work required to remove Fn from the substrate. Results are presented as mean ± SE with *p<0.05; #p<0.05 compared to 50% AT-PCL; @p<0.05 compared to 75% AT-PCL. (b) Schematic representation of the results obtained in (a). (i) Pristine samples: an increased length is indicative for an extended Fn conformation, with larger contact area with the substrate, whereas in (ii) (doped samples), a shorter length indicates a more folded, coil-like Fn conformation, with reduced contact area. (c) Quantification of FITC-Fn adsorption on the respective substrates. Results are presented as mean ± SD.

