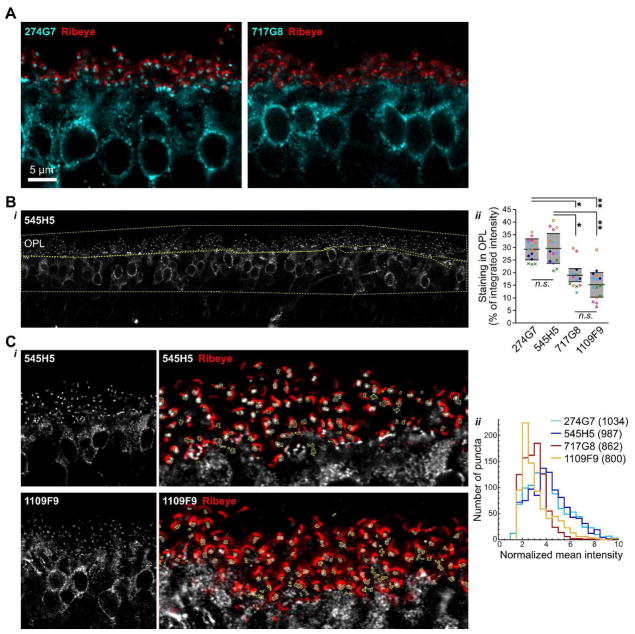
Figure 2.
Differential labeling of TRPM1 with different mAbs. (A) 274G7 (left) labels bipolar cell bodies and dendritic tip puncta, as expected for TRPM1, while labeling of dendritic tips with 717G8 (right) appears to be reduced. Samples were co-stained with ribeye antibody (red) to show the presence of similar numbers of synapses in both images. (B) Quantification of relative labeling in cell bodies and dendritic tips. Regions of interest (ROIs) encompassing the cell bodies and dendritic tips were drawn as shown in the example image (i, yellow lines). (ii) In samples labeled with 1109F9 and 717G8, significantly less of the total TRPM1 intensity was present in the dendritic tips. For each clone, 2–3 images were acquired from each of five eyes, from five different animals. Points show technical replicates, with biological replicates represented by different symbols. Horizontal lines and shaded areas indicate means ± s.d. of the means from each eye only, not including technical replicates. One-way ANOVA with Tukey’s Multiple Comparison Test was applied to the means from each eye only: *, p < 0.05; **, p < 0.001; n.s., not significant, n=5. (C) Quantification of individual dendritic tip puncta. (i) Example images used for quantification, with ROIs (yellow lines) and ribeye counterlabel (red), shown on the right in magnified views of the OPL region. (ii) Distributions of mean puncta intensities normalized by cell body labeling. The number of puncta included in each distribution is shown in the legend. 11–12 images from four animals were analyzed for each clone.

