Figure 7.
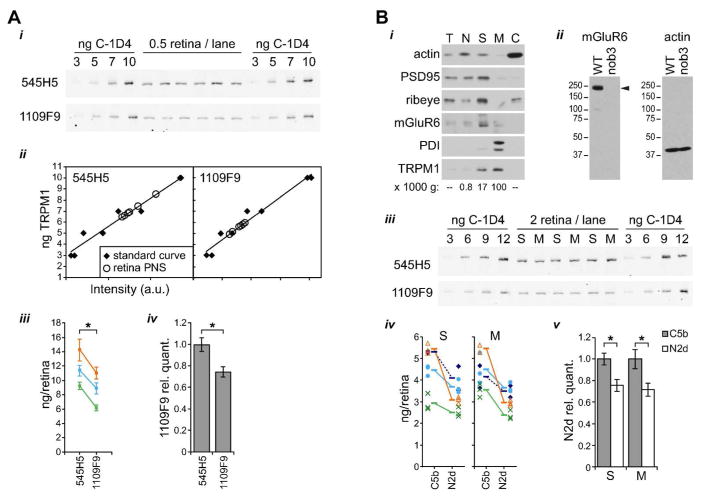
TRPM1 isoforms lacking exon 19 are present in both cell bodies and dendritic tips. (A) Quantitative western blots of retina post-nuclear supernatant (PNS) and standard curves of purified isoform C were labeled with 545H5 or 1109F9. (i) Example western blots. Each experiment was performed with two identical gels that were transferred and blotted in parallel. Each gel contained duplicate standard curves and six technical replicates of retina sample. (ii) Example quantitation of the westerns shown in (i). (iii) Results from 3 experiments are shown. Points and error bars show means ± s.d. of the six technical replicates from each western blot. Values obtained in the same experiment are color-coded and connected by lines. *, p < 0.01, paired t test with means only, not including technical replicates, n=3. (iv) For each experiment, the 1109F9 quantification was divided by the value obtained with 545H5. Bars represents means ± s.d., calculated with error propagation; *, p < 0.01, unpaired t test. (B) (i) Retinas were fractionated by differential centrifugation and equal amounts of total protein were loaded in each lane. Membranes were blotted for pre-synaptic markers PSD-95 and ribeye, post-synaptic marker mGluR6, ER marker PDI, and TRPM1 (using mAb 545H5). The relative force of the centrifugation is indicated below the relevant lanes. T, total; N, nuclei; S, synaptosomes; M, microsomes; C, cytoplasm. (ii) Validation of the mGluR6 antibody. Whole retina lysates from WT and Grm6nob3 mice (~0.25 retina/lane) were blotted with mGluR6 or actin antibody. mGluR6 (arrowhead) is detected in WT, but not nob3, retina. The apparent molecular weight of nearly 250 kDa is significantly different from the predicted size of 95 kDa, but is consistent with previously published western blots of mGluR6 (Orlandi et al., 2013; Cao et al., 2015). (iii) Quantitative westerns were performed as in (A), with three replicate lanes each for synaptosome (S) and microsome (M) fractions. (iv) Results from 4 experiments with either 545H5/1109F9 (solid lines) or 274G7/1109F9 (dashed lines) are shown. Points represent technical replicates, with each experiment represented by a different symbol. Means from each experiment are indicated by horizontal lines, and mean values obtained in the same experiment are connected by lines. (v) For each experiment, the N2d value was divided by the C5b value. Bars represent means ± s.d., calculated with error propagation; *, p < 0.005, unpaired t test. All quantitative westerns were performed with fluorescent secondary antibodies and imaged with an Odyssey scanner.

