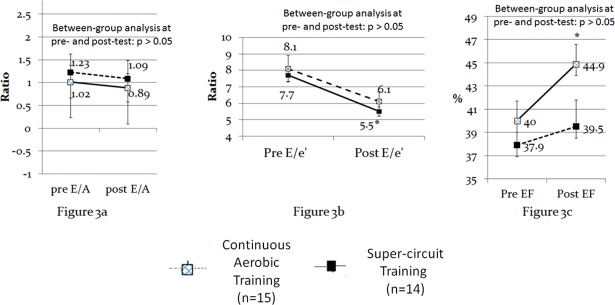
Fig 3. Within and between-groups differences in echocardiography.
Notes: * significant within-group changes from pre to post-test (dependent t-test,level of significance was set at 0.05 and adjusted to 0.016, using the Bonferroni correction). No between group differences were observed (intendent t-test). ES also revealed differences between the two training modalities effectiveness. More specifically, only the SCT group presented moderate-to-large ESs (Cohen's d ≥ 0.51) in echocardiography measures, whereas the CAT group presented only trivial ESs in two out of the three echocardiography measures (i.e., E/A and EF) (see Table 2).

