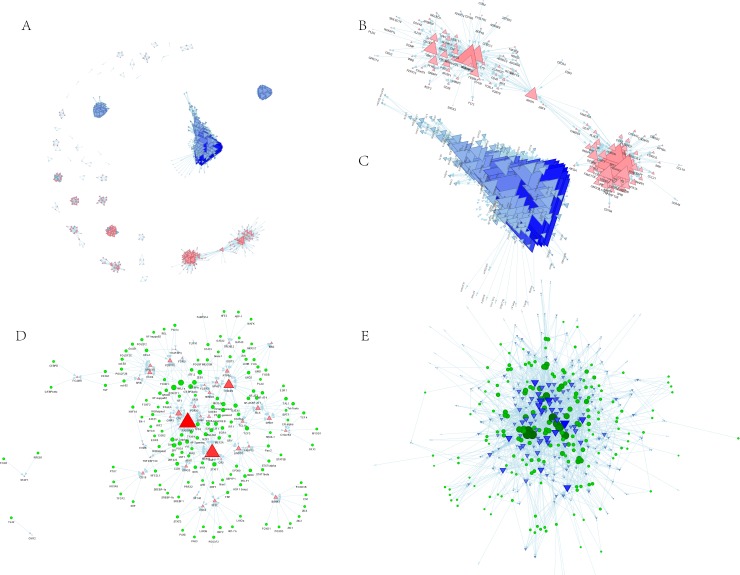
Fig 5. Transcription regulatory network of gene modules.
A: PPI network of DEGs. B: hub genes in the subnetwork of the blue module. C: Hub genes in the subnetwork of the yellow module. D: The transcriptional regulators of the main hub genes of the blue module. E: The transcriptional regulators of the main hub genes of the yellow module. The triangle represents the DEGs in each enriched module, the red color and the up-direction represent up-regulated DEGs; the blue color and the down-direction represent down-regulated DEGs. The size of the nodes was weighted by the power of the DEGs that interacted with transcriptional regulators.

