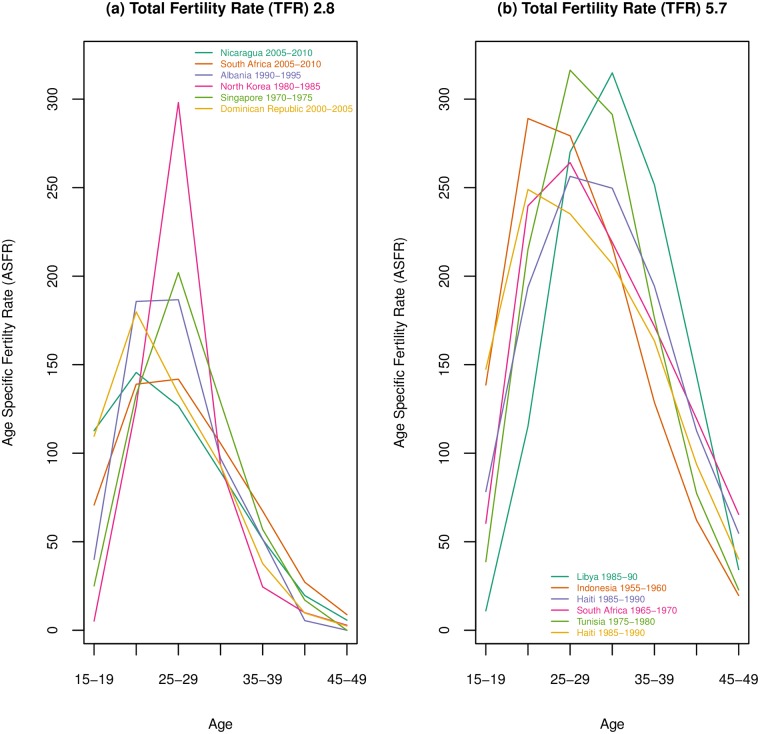
Fig 2. Example age-specific fertility curves producing the same total fertility rate.
The first panel shows a selection of age-specific fertility curves that create a total fertility rate of 2.8; the second panel shows different curves that sum to a total fertility rate of 5.7. Data from UN World Population Prospects [6].

