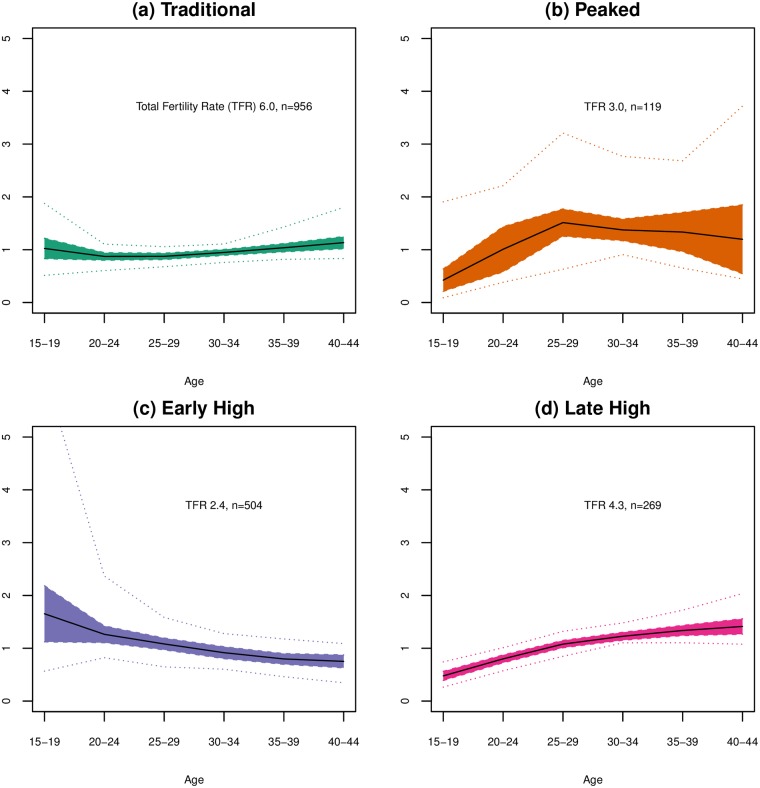
Fig 8. Changes to general age-specific fertility curve by cluster.
Median exponentiated reconstructed curve is shown with interquartile range shaded and dotted lines showing extrema values for combined changes to the base age-specific fertility curve by including weighted components 2 and 3 for each of the 4 clusters: (a) the Traditional Curve cluster; (b) Peaked cluster; (c) Early High cluster; and (d) Late High cluster. These curves show the cluster characteristic deviations from the first component curve; values of 1 represent no change to the base curve.

