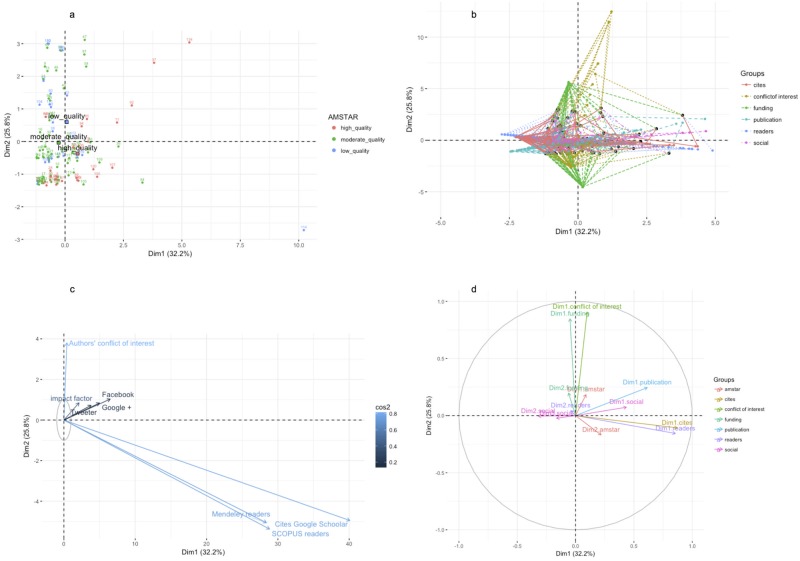
Fig 4. Multiple factor analyses (MFA).
This panel display four plots PC1—PC2 scores of reviews (a), variables (c), and group of variables (b-d). Fig 3a: reviews are colored based on methodological quality (red: high; green: moderate; blue: low); Fig 3b and 3d: projections of reviews to variable position and coordinates of the partial axes by variable were colored by group; Fig 3c: A gradient scale of blues represent values of squared cosines associated with PC1-PC2 variable projections.

