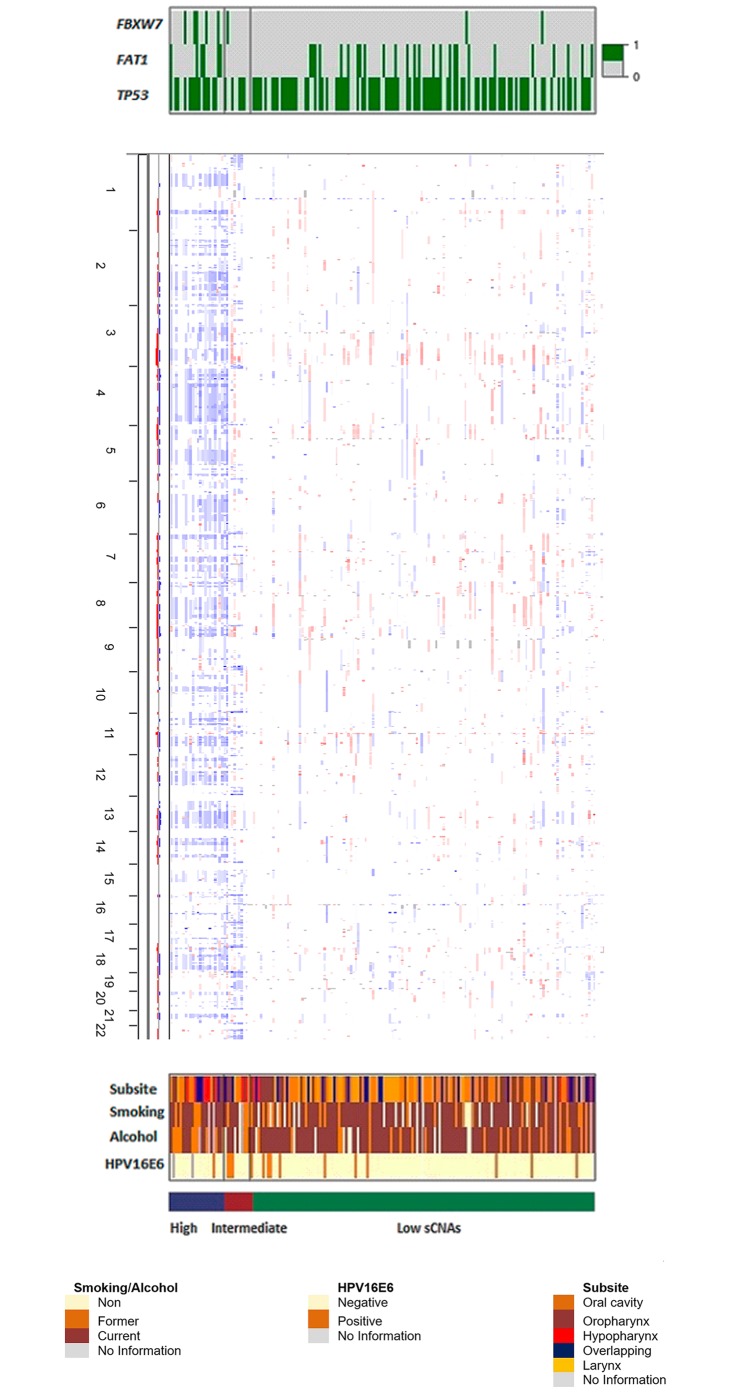
Fig 4. Integrative cluster analysis plot.
Cases are grouped by mutation and SCNA status. Top panel: only significant clustering genes are shown (0 = non-mutated, 1 = mutated), middle panel: SCNAs. Amplified (red) and deleted (blue) chromosomal regions. Altered regions are arranged vertically and sorted by genomic locus, with chromosome 1 at the top of the panel and chromosome 22 at the bottom, lower panel: colour coded clinical and epidemiological characteristics.

