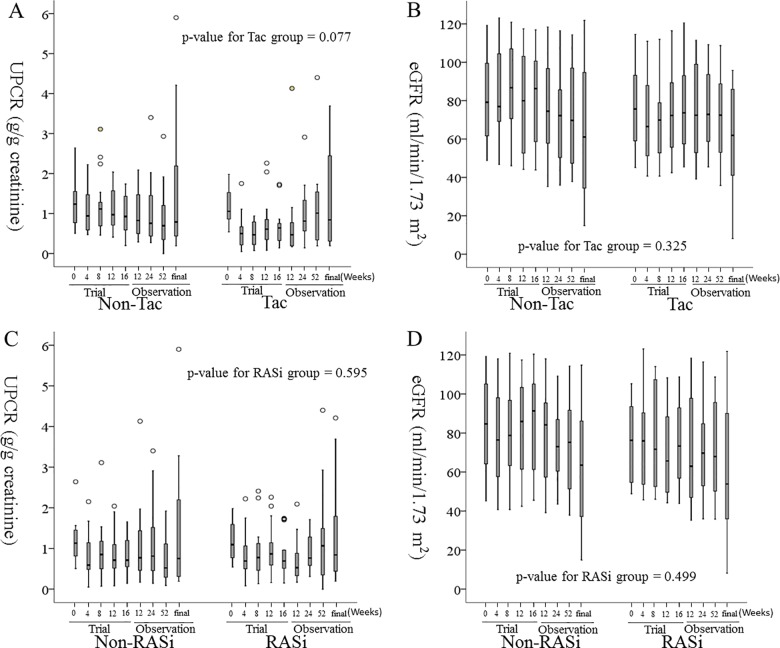
Fig 2.
The changes in UPCR (A, C) and eGFR (B, D) during the follow-up period after cessation of the clinical study. From left to right, each box-plot represents the follow-up periods of 0-weeks, 4-weeks, 8-weeks, 12-weeks and 16-weeks of the trial phase, and 12-weeks, 24-weeks, 52-weeks, and the final visit by October 2016 of the observational phase. A. The p-value for tests of between two groups was 0.130. B. The p-value for tests of between-subjects effects was 0.543. C. The p-value for tests of between-subjects effects was 0.830. D. The p-value for tests of between-subjects effects was 0.488. Tac: Tacrolimus, RASi: renin-angiotensin-aldosterone system inhibitor, UPCR: urine protein to creatinine ratio, eGFR: estimated glomerular filtration rate by the equation of CKD-EPI. The p-value estimated by linear mixed effect model.

