
Figure 8.
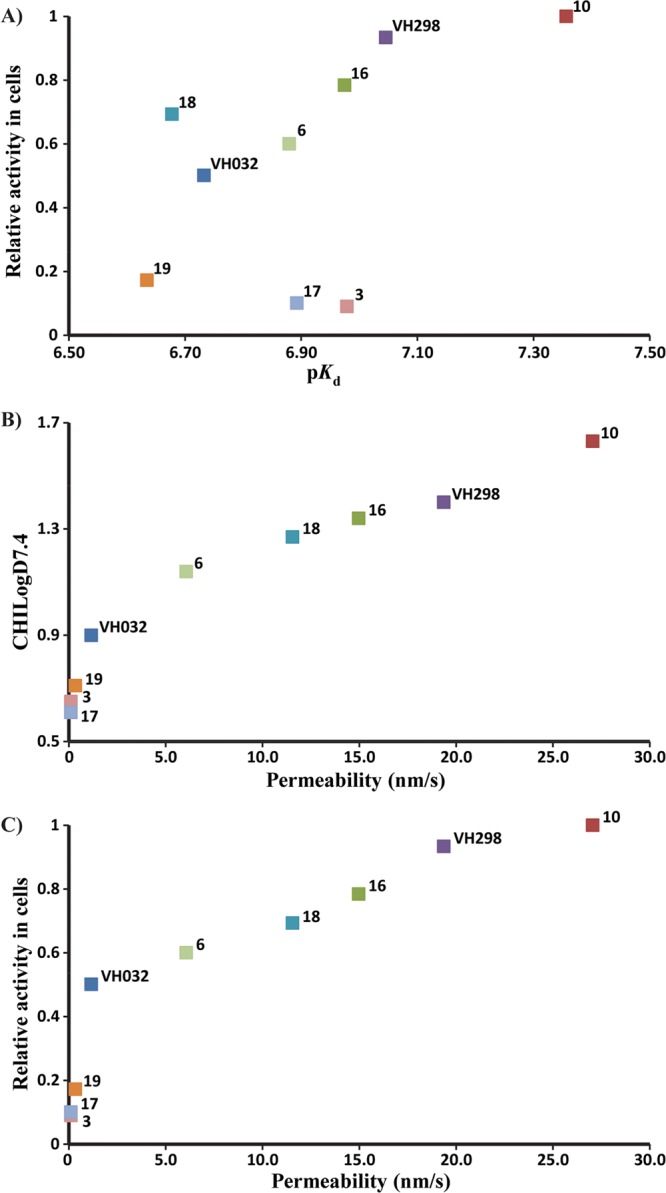
Correlations between cellular activity and physicochemical parameters in vitro. Reported values are from Tables 2 and 3 for inhibitors 1, 3, 6, 10, 15, and 16–19. (A) ITC pKd vs activity in cells. (B) CHILogD7.4 vs PAMPA permeability. (C) relative cellular activity vs permeability. HIF-1α protein levels measured using Western blot, as proxy of cellular activity, and normalized to protein levels with inhibitor 10.