
Figure 3.
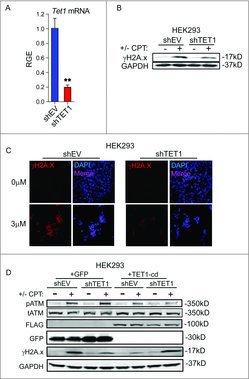
TET1 promotes H2A.x phosphorylation in non-tumorigenic cells. (A) qRT-PCR was conducted to measure TET1 knockdown following transduction with lentivirus encoding empty vector (shEV) or shRNA construct targeting TET1 in HEK293 cells. TET1 mRNA levels are relative to GAPDH and normalized to shEV control. Asterisks indicate significance by Student's t-test and error bars are SEM. We performed 3 technical replicates and 3 biologic replicates. P = 0.0046. (B) Western blotting of γH2A.x levels in HEK293 cells following 18 h of 3 µM camptothecin or vehicle exposure. GAPDH levels were used as loading control and blots are representative of 3 independent experiments. (C) Immunofluorescent staining of γH2A.x foci in HEK293 cells treated with 3 µM camptothecin or vehicle for 18 h. DAPI (blue) and γH2A.x (red) are shown at 40x magnification and images shown are representative of 3 independent experiments. (D) Western blotting of γH2A.x levels in control or TET1-deficient HEK293 cells. Cells were exposed to 3 µM camptothecin or vehicle for 18 h following transfection with control or TET1 catalytic domain (TET1-cd) expression vectors. FLAG was used to validate overexpression of FLAG-tagged TET1-cd and total H2A.x levels and GAPDH levels are shown as loading controls. Blot shown is representative of 2 independent experiments.