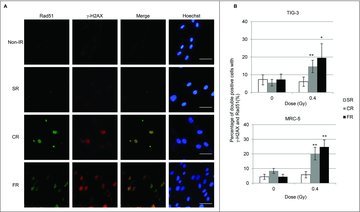
Figure 3.

γ-H2AX and Rad51 foci formation after IR. (A) Images of γ-H2AX (red) and Rad51 (green) positive cells at 24hours after SR, CR, or FR in MRC-5 cells. DNA was stained with Hoechst. The scale bar represents 50 µm. (B) The percentage of γ-H2AX and Rad51 double-positive cells is shown for each irradiation method in the graph. Asterisks indicate the significant difference of the percentage of double-positive cells in irradiated cells as compared with that of non-irradiated cells.
