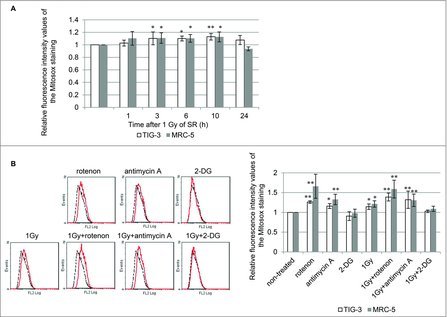
Figure 4.

ROS generation (A) FACS results for MitoSOX-red staining after 1 Gy of SR in TIG-3 and MRC-5 cells at the indicated time. The relative fluorescence intensity values of MitoSOX-red staining normalized to non-irradiated controls are shown. Asterisks indicate the significant difference of the relative fluorescence intensity values of the Mitosox staining in irradiated cells as compared with those of non-irradiated cells. (B) FACS results for MitoSOX-red staining in TIG-3 cells treated with rotenone, antimycin A, 2-DG, 1 Gy of SR, 1 Gy+rotenone, 1 Gy+anitimycin A, and 1 Gy+2-DG. Asterisks indicate the significant difference of the relative fluorescence intensity values of the MitoSOX-red staining in cells treated with the indicated reagents as compared with that of non-irradiated cells.
