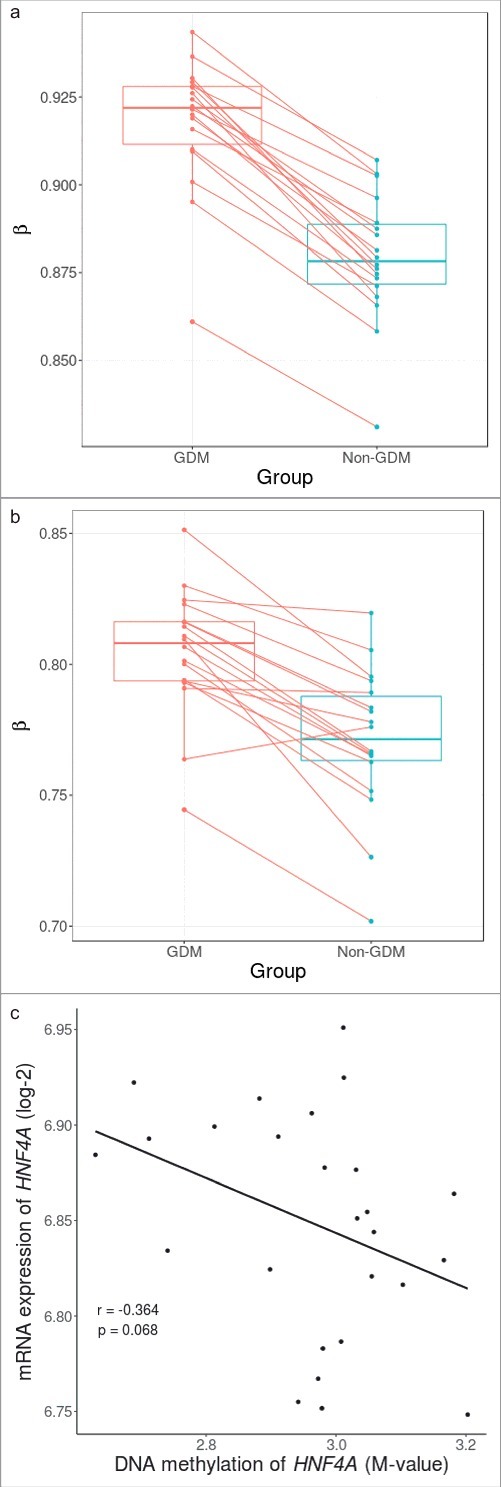
Figure 2.

Within sibling pair comparison of DNA methylation levels at cg08407434 and HNF4A gene and correlation with mRNA expression. (A) Within sibling pair differences in covariate-adjusted β values (GDM – non-GDM) at cg08407434 show consistent increased methylation in siblings exposed to GDM. (B) Within sibling pair differences of covariate-adjusted overall methylation levels of all CpG sites across the HNF4A region also show a marginal trend of increased methylation in siblings exposed to GDM (P = 0.053). (C) Overall DNA methylation level of HNF4A showed a negative correlation with mRNA expression albeit non significant (Pearson's coefficient: -0.364, P = 0.068).
