Figure 3.

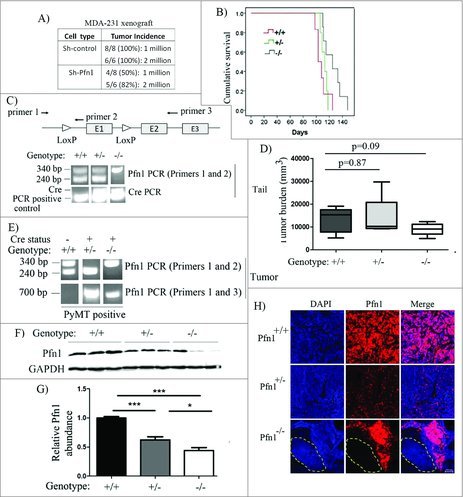
Effect of loss of Pfn1 on tumorigenicity in MDA-231 xenograft and MMTV:PyMT breast cancer models. (A) A table showing primary mammary tumor induction frequency following orthotopic inoculation of sh-control vs sh-Pfn1 MDA-231 cells in nude mice. (B) Top panel: A schematic diagram showing the positioning of lox sites in Pfn1flox/flox mouse with respect to the exons (indicated by E1, E2 and E3) and the PCR primers used for genotyping (primers 1 and 2) and confirmation of allele excision (primers 1 and 3) in PyMT+ mice of various Pfn1 genotypes. bottom panel: Pfn1- and Cre PCRs performed with tail-clip DNA. (C) A Kaplan-Meier curve showing relative survival of PyMT+ mice of various Pfn1 genotypes (survival was measured based on the number of days for largest tumor to reach 2.0 cm in size). (D) A bar graph showing the average tumor burden in PyMT+ mice of various Pfn1 genotypes. (E) Pfn1 PCRs performed with tumor-derived DNA (240 bp: wild-type (WT) allele amplicon, 340 bp: floxed allele amplicon, 700 bp: excision-specific amplicon). Note that all Cre-negative mice were considered to be Pfn1+/+ regardless of the nature of Pfn1 alleles (WT/flox, flox/flox, WT/WT). (F-G) A representative immunoblot depicting (F) and a bar graph summarizing (G) the relative Pfn1 expressions in PyMT tumors of the indicated Pfn1 genotypes. Three random tumors were analyzed per genotype; GAPDH immunoblot served as the loading control (data summarized from a pool of 18 random tumor samples from 6 animals of each genotype). (H) Representative IHC images PyMT mammary tumors of the indicated Pfn1 genotypes (Pfn1: red; DAPI: blue) reveal mosaic Pfn1 staining in Pfn1−/− tumors (the area outlined by a dashed line represents a region of the tumor comprised of Pfn1-null cells; bar -100 μm). Values are presented as mean ± SD (*p < 0.05, ***p < 0.001).
