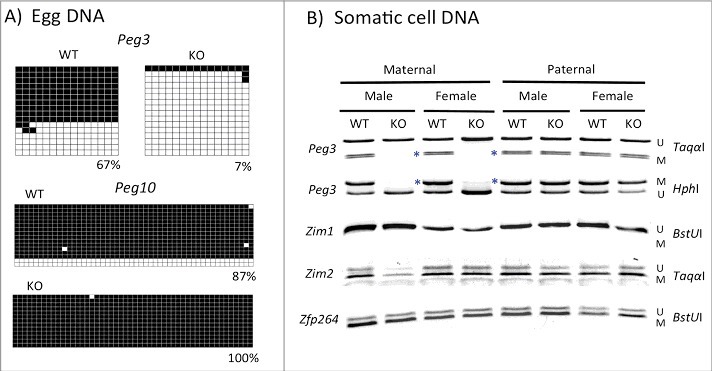
Figure 2.

Effects of the U1 deletion on the DNA methylation levels of the Peg3-DMR. (A) A series of DNA methylation analyses were performed with DNA from mature eggs isolated from two sets of 3-month-old females: WT and KO. Bisulfite-converted DNA was amplified with two sets of primers targeting Peg3-DMR and Peg10-DMR. Amplified PCR products were subsequently analyzed by individual sequencing. Each square represents a CpG site with close and open squares indicating methylated and unmethylated CpG, respectively. (B) A similar series of DNA methylation analyses were performed on a set of somatic DNA isolated from tails of WT and KO of both sexes with maternal and paternal transmission of the U1 deletion. Amplified PCR products were analyzed by COBRA. Each target region was digested with enzymes that can differentiate the methylation status of the original DNA. The letter U or M indicates the unmethylation or methylation status, respectively, based on the digestion pattern by a given restriction enzyme. The blue * indicates the mutational effects of the U1 deletion on the Peg3-DMR: removal of maternal-specific DNA methylation.
