
Figure 6.
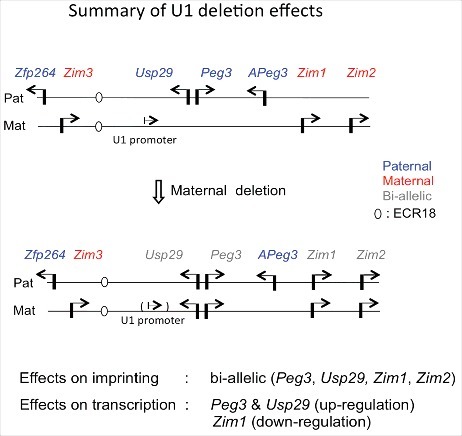
Summary of U1 deletion effects on imprinting and expression of the Peg3 domain. A schematic representation of the Peg3 domain is shown on the upper panel. Each imprinted gene is indicated with an arrow. Paternally and maternally expressed genes are indicated in blue and red, respectively. Biallelically expressed genes are indicated in gray. The position of ECR18, a potential enhancer, is indicated with an oval. Mutational effects by maternal transmission of the U1 deletion are summarized from results derived from total RNA isolated from neonatal heads of both sexes. Paternal transmission of the U1 deletion did not cause any major effects, thus omitted in this summary.