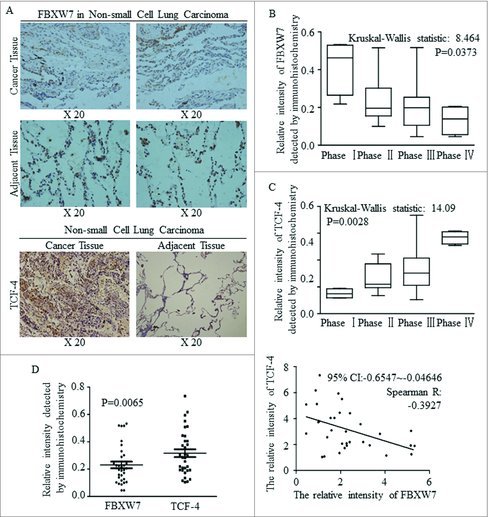
Figure 3.

A negative correlation between the expression of FBXW7 and TCF-4 in tissue level. (A) IHC staining for Fbxw7 and TCF4 in tumor-adjacent tissues and NSCLC tissues, original magnification, 200 ×. (B-C) Statistical analysis of Fbxw7 (B) and TCF-4 (C) staining in NSCLC specimens at the different clinical stages (Kruskal-Wallis statistic: 8.464 and14.09, P: 0.0373 and 0.0028, respectively). (D) Using IHC staining, the relative expression and linear correlation of FBXW7 and TCF-4 were analyzed in NSCLC tissues respectively (P < 0.0065, Spearman R: -0.3927).
