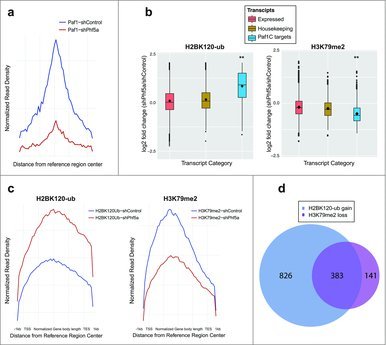
Figure 2.

(a) Normalized read density profiles following Paf1 ChIP-sequencing centered on reference regions in the presence (blue) or absence (red) of Phf5a. (b) Box plots representing log2 fold change of normalized read density for H2BK120-ub, and H3K79me2 ChIP-sequencing in ESCs following shControl or shPhf5a silencing. Plots represent comparisons of all expressed transcripts in ESCs with housekeeping genes and also direct Paf1 targets around their gene bodies. **p<0.0001, non-parametric Wilcoxon signed rank test. (c) Normalized read density profiles around gene bodies, following ChIP-sequencing of H2BK120-ub and H3K79me2, on Paf1C targets and pluripotency genes in ESCs in the presence (blue) or absence (red) of Phf5a. (d) Venn diagram representing the numbers of genes in which H2BK120-ub densities are gained and H3K79me2 densities are lost, respectively, following shPhf5a depletion.
