
Figure 1. MetaboDrift user interface.
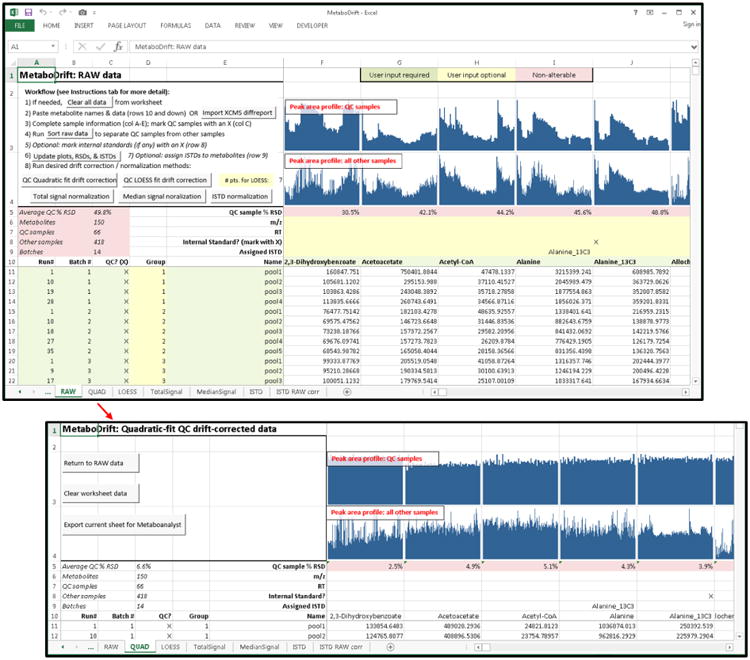
Raw data are input or imported into the worksheet. Using automated scripts, data are sorted, visualized, and the desired normalization method(s) are applied to the data. Resulting output are displayed as additional worksheets within the workbook and can be exported for further analysis.