
Figure 3. Comparison of quantitation after drift-correction versus internal standard normalization.
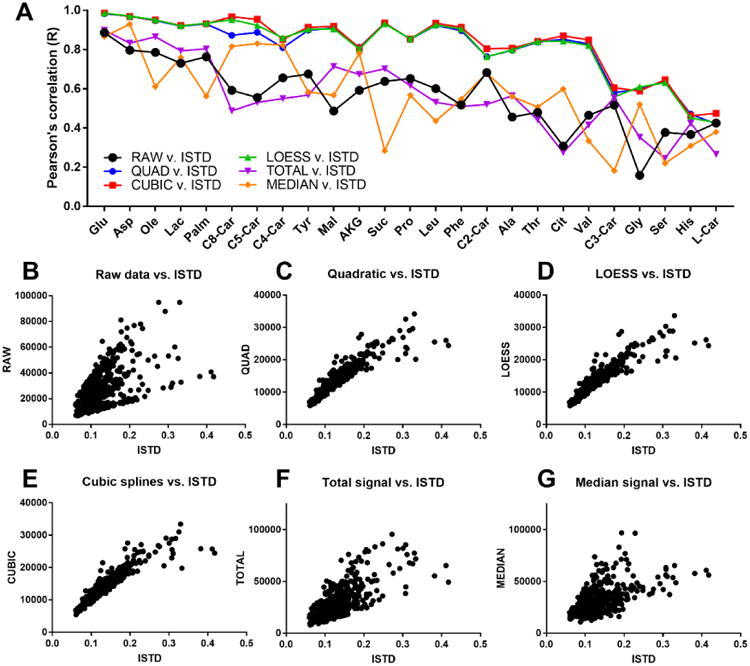
(a) Pearson's correlation coefficients between IS-normalized peak area and peak areas normalized by other strategies were calculated in Excel for metabolites with matching isotopic standards using all biological samples from the MMTT study. (b-g) Scatter plots illustrating correlation between IS-normalization and other strategies for a single representative metabolite, malic acid.