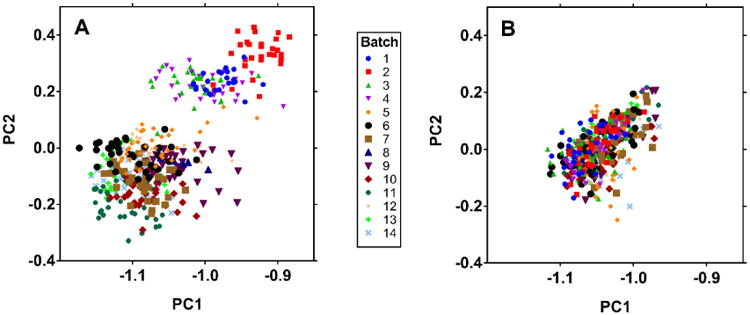
Figure 4. Principal component analysis of MMTT data before and after drift correction.

PCA 2D score plots illustrate prominent batch effects before correction (a) and elimination of most batch effects post-correction (b). Data before and after drift correction are projected onto the same principal component axes. Samples are colored by batch number (1-14).
