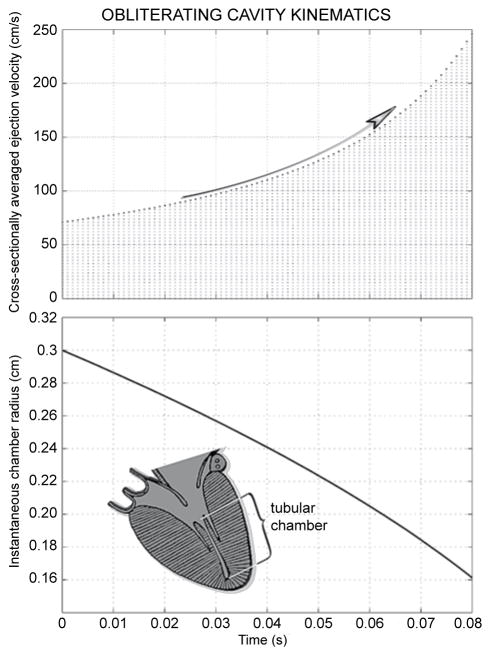
Figure 3.
Fluid dynamic computer simulation results; inset depicts geometry. As demonstrated in the top panel, the cross-sectionally averaged outlet velocity increases at an increasing rate with advancing cavity shrinkage, attaining nearly 2.5 m/s by the time the effective radius falls to 0.16 cm, only slightly more than half its starting value, shown in the lower panel.

